FxWirePro: BTC/USD takes support near 55-EMA, break below targets 812
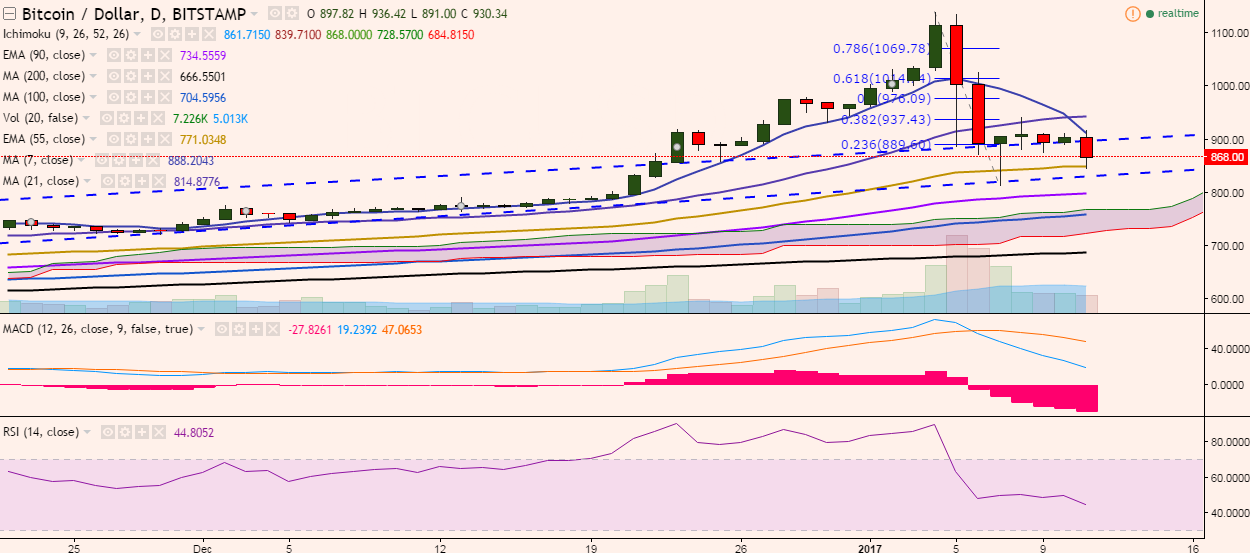
BTC/USD failed to break above 21-day MA and turned red on Wednesday. It is currently trading at 866 levels at press time (Bitstamp). Ichimoku analysis of daily chart: Tenkan Sen: 976.08 Kijun Sen: 955.56 Trend reversal: …
BTC/USD failed to break above 21-day MA and turned red on Wednesday. It is currently trading at 866 levels at press time (Bitstamp).
Ichimoku analysis of daily chart:
Tenkan Sen: 976.08
Kijun Sen: 955.56
Trend reversal: 796.22 (90 EMA)
Momentum studies remain bearish – RSI(14) is at 44; MACD line is below the signal line and the bearish crossover of 7-DMA and 21-DMA.
On the upside, the pair will run into resistance is seen at 895 levels (trend line joining 628.99 and 745.19) and a break above would target 937.43 (38.2% retracement of 1139.89 and 812.28)/947.25 (7-DMA).
On the reverse side, the pair has taken support near 847.80 (55-EMA) and a break below is likely to drag the pair to 812.28 levels (December 07 low)/ 796.22 (90-EMA).