


 Bitcoin Cracks $75K as $1.3B ETF Exodus and Middle East Jitters Spook Bulls; Bears Eye $70K
  Bitcoin Buckles at $73,500: Middle East Tensions and Weak Institutional Demand Set Bearish EMA Stack on $70K Collision Course
  Ether Breaks Below $2,100: Triple EMA “Sell-the-Rally” Setup Targets $1,900
  Ethereum Cracks Below $2,000 as Bitcoin Contagion Bites—Bearish EMA Stack Sets Sights on $1,700
  FxWirePro- Major Crypto levels and bias summary


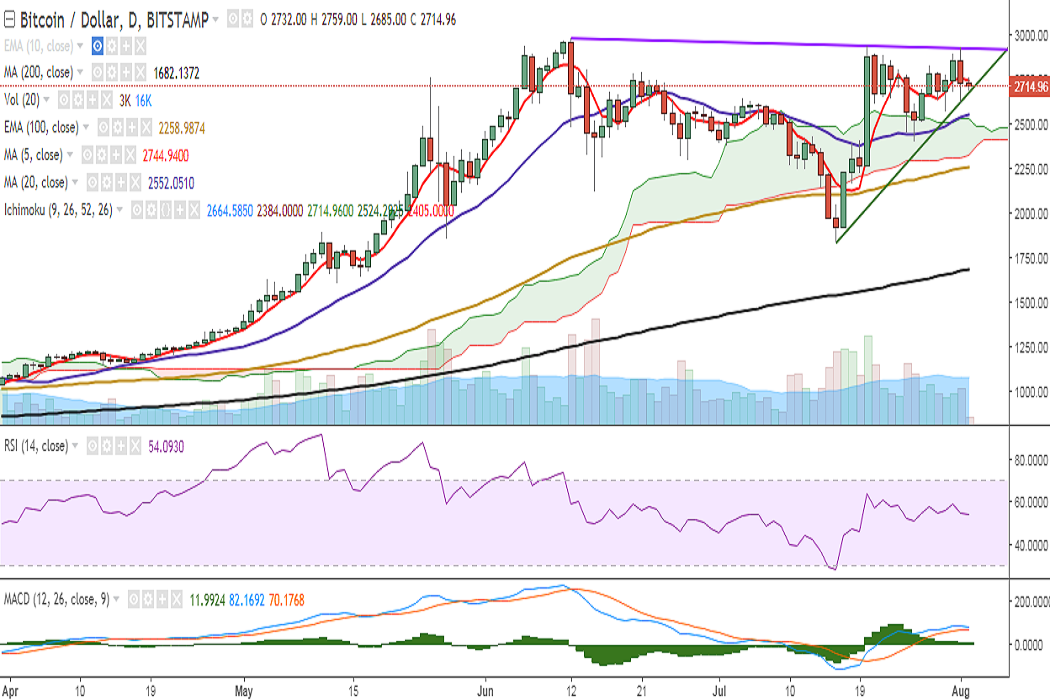
BTC/USD is trading in a narrow range on Wednesday and trading at 2720 levels at the time of writing (Bitstamp).
Ichimoku analysis of daily chart:
Tenkan Sen: 2664.58
Kijun Sen: 2384
On the upside, the pair faces immediate resistance at 2744 (7-DMA) and a consistent break above would target 2825 (28 July high)/2860 (4h upper Bollinger)/2922 (trend line joining 2980 and 2938). Further uptrend would target 2980 (June 12 high)/3091 (113% retracement of 2980 and 2120).
On the reverse side, the pair is trading just above 2675 (trend line joining 1830 and 2615) and a break below would drag it to 2569 (July 30 low)/2534 (50-DMA). Further weakness would target 2483 (55-EMA)/ 2400 (July 26 low)/2325 (Cloud bottom).
Momentum studies: The pair is trading in a “Rising triangle” pattern and a break above 2922 would confirm further upside.
Bias appears neutral on the daily chart. On the weekly chart, the pair is holding well above 7-DMA and stochs are on the verge of a rollover into the overbought zone.
Recommendation: Wait for a clear directional bias.
FxWirePro launches Absolute Return Managed Program. For more details, visit http://www.fxwirepro.com/invest

- News

- Economy

- Central Banks
- Investing
- Research
- Roundups
- Digital Currency
- Insights
- Technical Analysis
- Technology
- Business
- Law
- Health
- Nature
- Fintech
- Science
- Topic
- Opinions
- ©Econometrics LLC . All Rights Reserved.
FxWirePro: BTC/USD trades in Rising Triangle pattern, break above 2922 confirms bullishness
Wednesday, August 2, 2017 10:47 AM UTC
Editor's Picks


- Market Data
Most Popular


