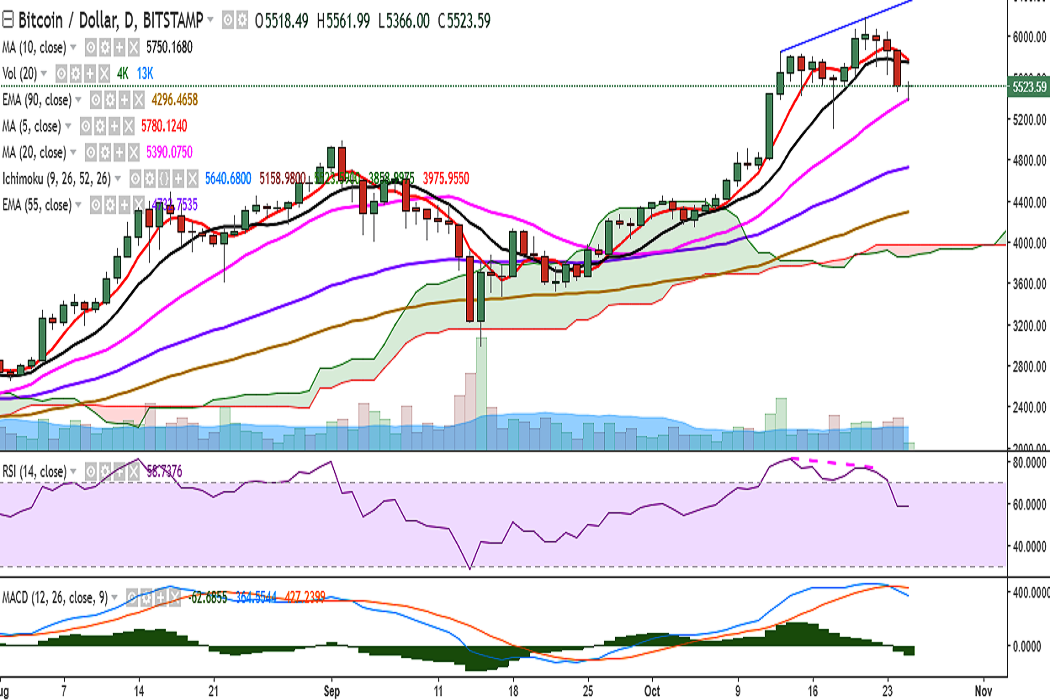
BTC/USD continued downtrend on Wednesday and has hit a low of 5366 levels so far in the day. It is currently trading at 5534 levels at the time of writing (Bitstamp).
Ichimoku analysis of daily chart:
Tenkan Sen: 5640.68
Kijun Sen: 5158.98
On the upside, resistance is seen at 5580 (1h 20-SMA) and a consistent break above would target 5665 (2h 20-SMA)/5747 (10-DMA). Further strength would see it testing 5840 (2h 50-SMA)/5943 (113% retracement of 5846.43 and 5101.36)/6000.
On the flipside, the pair has found support at 5390 (20-DMA) and bounced to above 5500 levels. A decisive break below 20-DMA would see the pair testing 5233 (1w 5-SMA)/ 5101 (October 18 low). Further weakness would target 5000/4954 (38.2% retracement of 2972.01 and 6180).
Momentum studies: Bias appears bearish on the daily chart with stochs biased lower and bearish MACD crossover. However, RSI is strong at 59.
Intraday bias also appears bearish at the time of writing.
Recommendation: Good to go short on break below 20-DMA. SL: 5581. TP: 5233/5101.
FxWirePro launches Absolute Return Managed Program. For more details, visit http://www.fxwirepro.com/invest