


 FxWirePro- Major Crypto levels and bias summary
  Ether Breaks Below $2,100: Triple EMA “Sell-the-Rally” Setup Targets $1,900
  Bitcoin Buckles at $73,500: Middle East Tensions and Weak Institutional Demand Set Bearish EMA Stack on $70K Collision Course
  ETH Cracks $2,100 in Bitcoin’s Wake as Bearish EMA Stack Deepens; Sellers Target $1,900 on Rallies
  Bitcoin Bleeds $704M in ETF Outflows as Institutional Exodus Accelerates
  Ethereum Cracks Below $2,000 as Bitcoin Contagion Bites—Bearish EMA Stack Sets Sights on $1,700
  FxWirePro- Major Crypto levels and bias summary


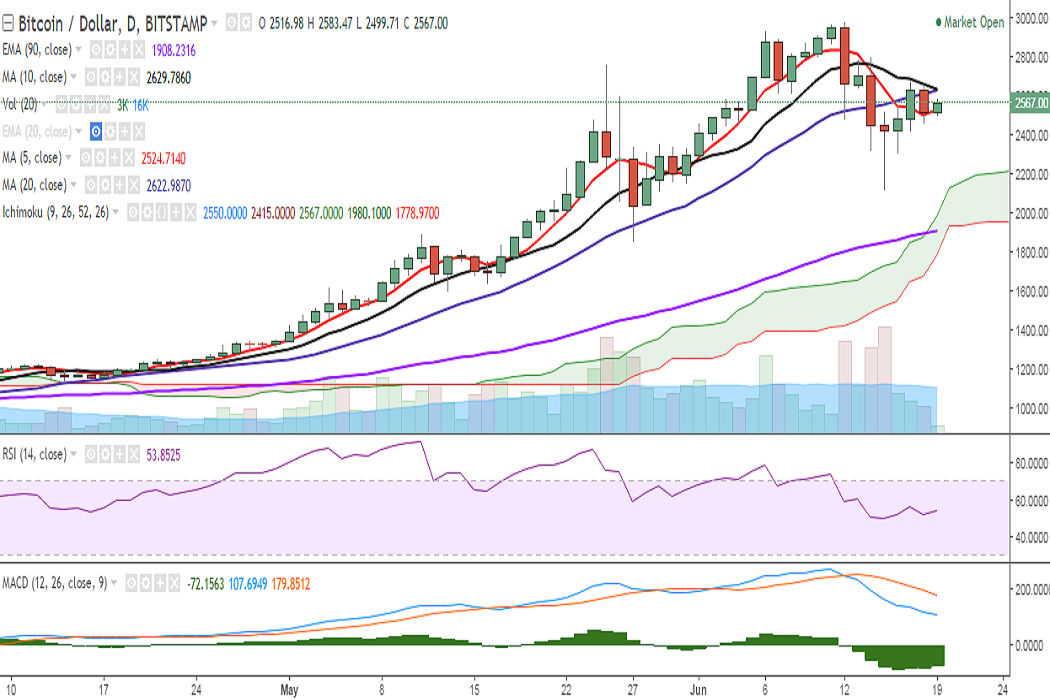
BTC/USD is consolidating in a narrow range as its upside is being capped by 10-DMA. It is currently trading at 2565 levels at the time of writing (Bitstamp).
Ichimoku analysis of daily chart:
Tenkan Sen: 2550
Kijun Sen: 2415
On the upside, resistance is seen at 2614 (4h 50-SMA) and a break above would see it testing 2651 (61.8% retracement of 2980 and 2120)/2760 (May 25 high). Further strength would then target 2878 (113% retracement of 2760 and 1850)/2933 (June 06 high)/ 2980 (June 12 high).
Support is seen at 2489 (2h 50-SMA) and a break below would drag it to 2425 (4h 200-SMA)/2322 (23.6% retracement of 2980 and 2120)/2281 (61.8% retracement of 1850 and 2980)/2166 (50-DMA).
Momentum studies: On the daily chart, RSI is at 51 and stochs are biased higher. However, MACD line is below the signal line. Also, 10- and 20-DMA are on the verge of a bearish crossover.
Bias appears neutral on the hourly charts, however, weekly charts suggest bullish bias. On the weekly chart, RSI is holding at 73, MACD line is above the signal line.
Recommendation: Bias appears neutral at the moment. Traders are preferred to wait for a confirmed signal on the daily charts.

- News

- Economy

- Central Banks
- Investing
- Research
- Roundups
- Digital Currency
- Insights
- Technical Analysis
- Technology
- Business
- Law
- Health
- Nature
- Fintech
- Science
- Topic
- Opinions
- ©Econometrics LLC . All Rights Reserved.
FxWirePro: BTC/USD upside capped by 10-DMA, bias neutral
Monday, June 19, 2017 9:09 AM UTC
Editor's Picks


- Market Data
Most Popular


