


 BTC’s Bear Bounce: Sell the Rally Near $66K as Bears Target $59K–$52K Breakdown
  FxWirePro- Major Crypto levels and bias summary
  FxWirePro- Major Crypto levels and bias summary
  FxWirePro- Major Crypto levels and bias summary


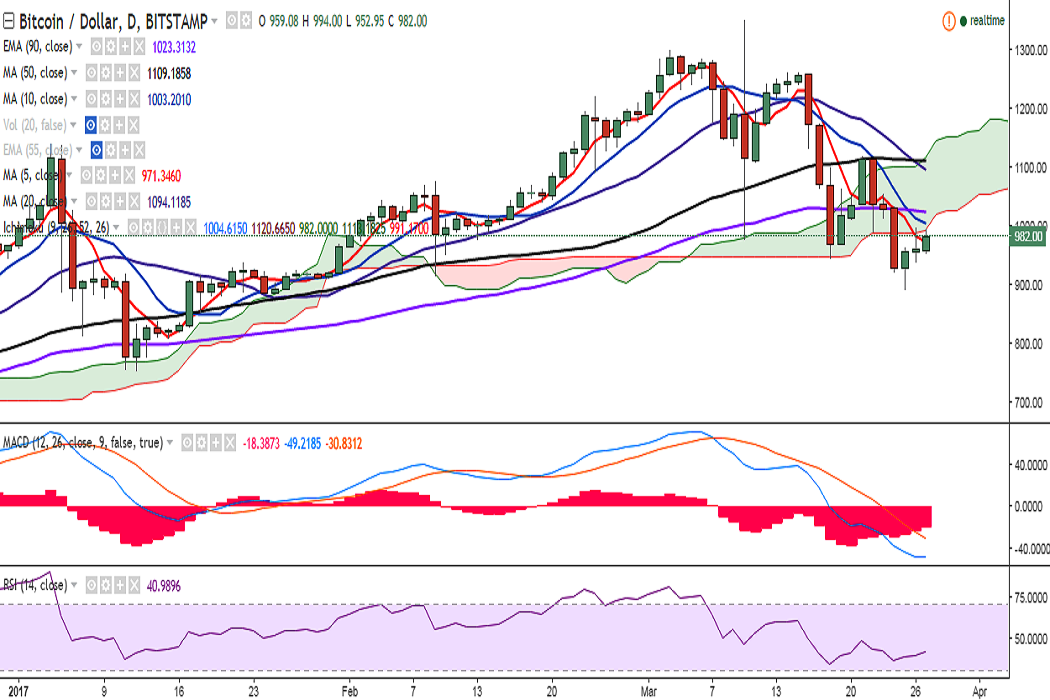
BTC/USD dropped to 891.33 levels on March 25, after it broke below the Ichimoku cloud. The pair has restored its strength to above5-DMA and is currently hovering around Cloud bottom at 992 levels at the time of writing (Bitstamp).
Ichimoku analysis of daily chart:
Tenkan Sen: 1004.61
Kijun Sen: 1120.66
The pair is currently hovering around Cloud bottom and a consistent break above would see it testing 1012.10 (10-DMA)/1024.24 (90-EMA)/1066.54 (38.2% retracement of 1350 and 891.33). Bullishness could be confirmed if the pair edges above Ichimoku cloud.
In the daily chart, support is seen at 976.68 (2H 50-SMA) and a break below would drag it to 913.73 (February 09 low)/891.33 (March 25 low). In the weekly chart, watch out for a close below 946.60 (20-SMA) for further downside.

- News

- Economy

- Central Banks
- Investing
- Research
- Roundups
- Digital Currency
- Insights
- Technical Analysis
- Technology
- Business
- Law
- Health
- Nature
- Fintech
- Science
- Topic
- Opinions
- ©Econometrics LLC . All Rights Reserved.
FxWirePro: BTC/USD upside capped by Ichimoku Cloud, stay short
Monday, March 27, 2017 10:46 AM UTC
Editor's Picks


- Market Data
Most Popular


