


 FxWirePro: GBP/AUD downtrend loses steam but outlook still bearish
  FxWirePro- Woodies pivot (Major)
  FxWirePro- Major Pair levels and bias summary
  FxWirePro- Woodies pivot (Major)
  FxWirePro: USD/CAD retreats slightly but trend is still bullish
  NZDJPY Pulls Back on Kiwi Weakness: Buy Dips at 94.40 Targeting 97
  FxWirePro: EUR/ AUD dips below 1.6300 level, focus on near term support
  FxWirePro: GBP/USD stays below 1.3400 level following cooler inflation report
  FxWirePro- Major Pair levels and bias summary
  FxWirePro: EUR/ AUD downtrend loses steam, remains on bearish path
  GBPJPY Weakens on Soft UK CPI: Sell Below 217.80 Targeting 216.40
  JPY Action Bias: USDJPY, AUDJPY & EURJPY Turn Extremely Bullish – Top Pairs to Watch
  FxWirePro: AUD/USD rallies on jobs surge, heads to test key resistance
  FxWirePro: USD/CAD retains bid tone,eyes 1.4200 level
  FxWirePro: GBP/NZD downtrend loses steam, remains on bearish path
  Major Pair Action Bias: USDCHF Turns Bullish as EURUSD Stays Bearish – Key Pairs to Watch
  FxWirePro: GBP/USD slips as Middle East tensions boost safe-haven dollar


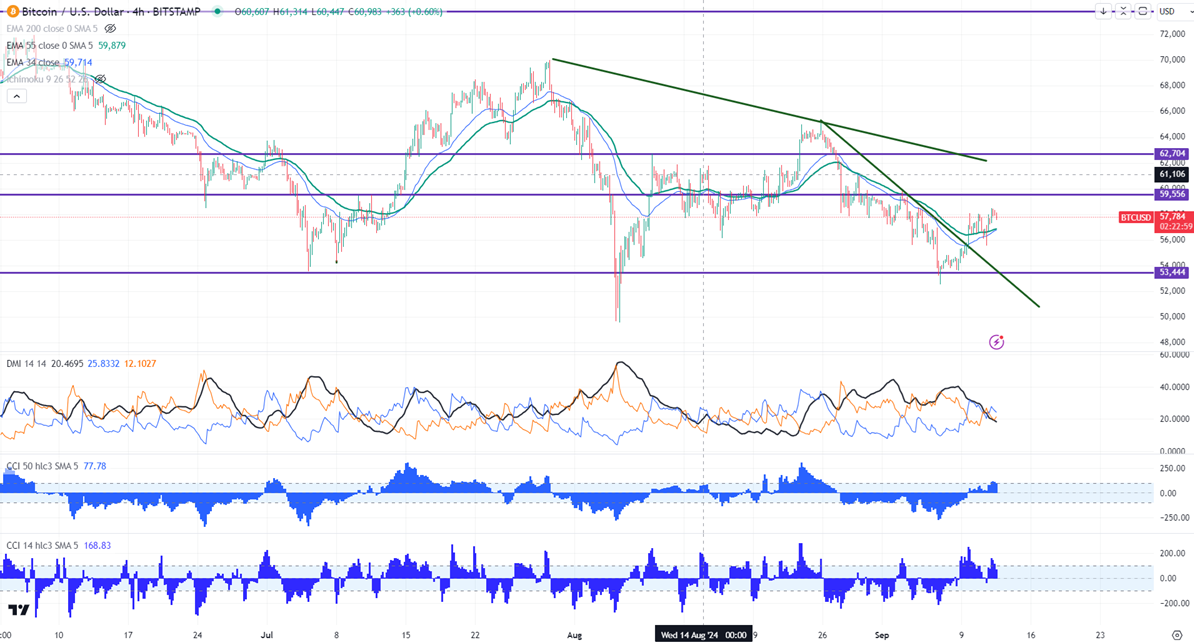
BTCUSD trades flat despite mixed US PPI. It hit a high of $58470 and is currently trading at around $57693.
|
Time (GMT) |
Currency |
Event |
Actual |
Forecast |
Previous |
|
12:30 pm |
US |
PPI y/y |
1.7% |
1.8% |
2.2% |
|
|
|
Core PPI y/y |
2.4% |
2.5% |
2.4% |
|
|
|
PPI m/m |
0.20% |
0.10% |
0% |
|
|
|
Core PPI m//m |
0.30% |
0.20% |
0% |
|
|
US |
Unemployment claims |
230K |
227K |
228K |
BTC ETF has seen outflows of $43.97 million on Wednesday mainly led by ARK Invest recorded $54.03 million, According to SoSoValue.
Coinglass’s Binance BTC Long to Short ratio above 1 indicates bullishness.
According to the CME Fed watch tool, the probability of a 25 bpbs rate cut in Sep increased to 67% from 56% a week ago.
US markets -
NASDAQ (No correlation with BTC) - Bearish (neutral for BTC). The NASDAQQ trades flat ahead of US CPI. Any close below 18000 will take the index to 17400.
Technicals-
BTCUSD trades above the short-term moving average 34- EMA and 55 EMA and below the long-term moving average (200 EMA) in the 4-hour chart.
In the daily chart, BTC holds below short and long-term moving averages. This confirms minor weakness.
Minor support- $55000. Any break below will take it to the next level at $52500/$50000/$46000.
Bull case-
Primary supply zone -$58975. Any break above confirms an intraday bullishness. A jump to $60000/$61800/$63000/$65000/$67000/$70000 is possible.
Secondary barrier- $70000. A close above that barrier targets $750000/$80000.
Indicator (4-hour chart)
CCI (14)- Neutral
CCI (50)- Bullish
Average directional movement Index - Neutral
It is good to buy on dips around $55000 with SL around $52000 for TP of $67000.


