


 NZDJPY Bearish Breakdown: Why Selling the Rallies is the Strategic Play
  FxWirePro: USD/CNY drifts lower, vulnerable to more downside
  FxWirePro: EUR/AUD falls below 1.6600 level, plunge to test a key fibo grows
  FxWirePro- Major Crypto levels and bias summary
  Ethereum Braces for Volatility: Technicals Turn Bearish as Geopolitical Tensions Loom
  FxWirePro- Major Pair levels and bias summary
  FxWirePro: NZD/USD neutral in the near-term, scope for downward resumption
  FxWirePro: GBP/AUD downtrend extends, eyes 1.8900 evel
  FxWirePro: USD/JPY edges up as yen dips after soft household spending data
  Aussie Ascent: AUDJPY Charges Toward 112 as Bullish Momentum Hits Five-Day High
  FxWirePro: USD/CNY falls to three-year high, scope for further downside
  FxWirePro: AUD/USD spikes as Trump announces two-week Iran ceasefire
  GBPJPY Surges to 211.88: Sterling Bulls Target 215 Amid Broad-Based Buying
  FxWirePro:NZD/USD jumps as RBNZ warns of higher OCR potential
  Aussie Bulls Charge: AUD/JPY Rallies as Geopolitical Clouds Part
  EUR/JPY Breaks Out: Euro Surges Past 185.00 Resistance Amid Strong Bullish Momentum


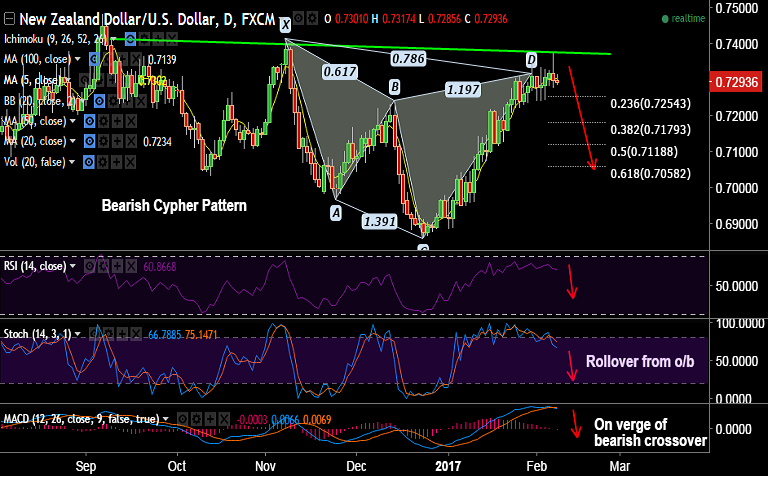
'Bearish Cypher' pattern evidenced on NZD/USD daily charts.
The pair was rejected at major trendline resistance at 0.7375 on Tuesday's trade.
Price action has slipped below 5-DMA, close below will add to bearish bias.
Technical indicators are bearish. RSI is biased south, Stochs are showing a rollover from overbought zone.
MACD is on the verge of a bearish crossover on signal line, which if materialises will add further downside confirmation.
Support levels - 0.7254 (23.6% Fib retrace of 0.68621 to 0.73754 rally), 0.7234 (20-DMA), 0.72, 0.7179 (38.2% Fib)
Resistance levels - 0.7302 (5-DMA), 0.7350 (Jan 31 high), 0.7375 (trendline & Feb 7 high)
TIME TREND INDEX OB/OS INDEX
1H Bearish Neutral
4H Neutral Neutral
1D Neutral Neutral
1W Bullish Neutral
Recommendation: Good to go short on close below 5-DMA at 0.73, SL: 0.7375, TP: 0.7250/ 0.72/ 0.7180
FxWirePro Currency Strength Index: FxWirePro's Hourly NZD Spot Index was at 22.9009(Neutral), while Hourly USD Spot Index was at 54.6389 (Bullish) at 0630 GMT. For more details on FxWirePro's Currency Strength Index, visit http://www.fxwirepro.com/currencyindex.

- News

- Economy

- Central Banks
- Investing
- Research
- Roundups
- Digital Currency
- Insights
- Technical Analysis
- Technology
- Business
- Law
- Health
- Nature
- Fintech
- Science
- Topic
- Opinions
- ©Econometrics LLC . All Rights Reserved.
FxWirePro: 'Bearish Cypher' on NZD/USD, good to short close below 5-DMA at 0.7303
Wednesday, February 8, 2017 6:36 AM UTC
Editor's Picks


- Market Data
Most Popular


