


 Gold Prices Fall Amid Rate Jitters; Copper Steady as China Stimulus Eyed


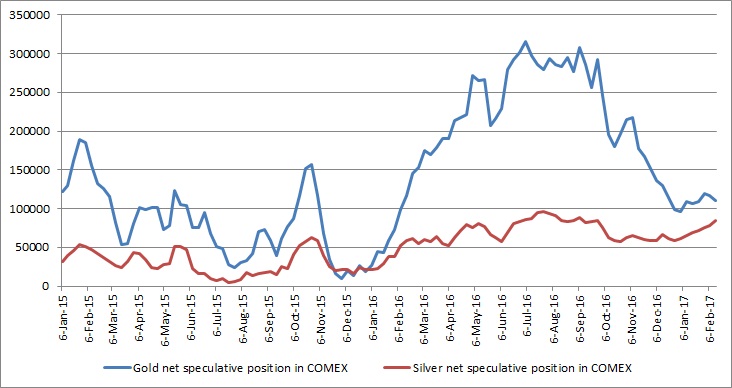
Something odd is happening in the gold & silver positions made by the speculative traders. Speculators have increased their long positions in silver for seven consecutive weeks as per the commitment of traders report released by CFTC. In the past 11 weeks, speculators have covered their silver longs only twice. Compared to that, speculators have reduced their gold longs for second consecutive week. In the past 11 weeks, speculators have reduced their gold longs in seven of them. The first chart shows the net speculative positions in Comex for gold and silver.
The second chart shows the difference in long positions between the gold and silver, which is at their lowest since February last year. In February last year, one troy ounce of gold was buying more than 83 troy ounces of silver, which was the highest since 2008, when it was buying more than 84 troy ounces of silver. Since February 2016, the gold/silver ratio has been declining and currently at 68.7. The positioning in the Comex suggests a further decline in the ratio. Whenever this ratio declines, the precious pack outperforms.


