


 Bitcoin’s Volatile Reset: ETFs Rebound as Bulls Eye USD 80,000 Milestone
  FxWirePro: USD/CAD recovers slightly but bearish outlook persists
  FxWirePro: USD/ZAR recovers slightly but trend is still bearish
  FxWirePro- Major European Indices
  FxWirePro: USD/JPY holding bid into weekend
  FxWirePro: GBP/NZD up trend gains some momentum but hurdles ahead
  Euro Holds the Line: EURUSD Finds Support at the 365-EMA as Peace Talks Loom
  FxWirePro: GBP/NZD down trend loses steam, remains on bearish path
  FxWirePro:NZD/USD uptrend loses momentum but bullish setup remains
  NZDJPY Bulls Charge Toward 95.00: Safe-Haven Exodus Drives Kiwi Rally
  FxWirePro: GBP/AUD positions for another drop, eyes 1.8900level
  Ethereum Consolidates: Bullish Technicals Point to a Potential $3,000 Breakout
  FxWirePro: EUR/AUD under pressure as key support gives way
  Energy Surge Ignites US Inflation: USDCHF Eyes Support Amid Dollar Sell-Off
  FxWirePro: EUR/AUD downtrend loses steam but outlook still bearish
  FxWirePro: USD/ZAR edges lower ,investors remain on edge


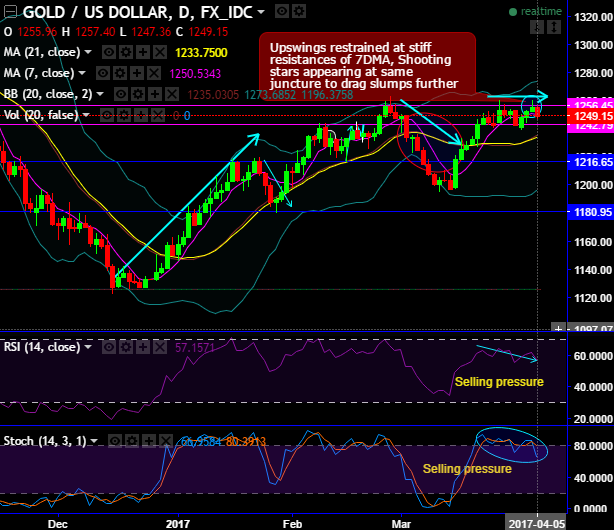
In an interim uptrend, gold prices have almost retraced upto 61.8% from the lows of 1046.54 to the recent highs of 1261.25 levels in the consolidation phase, but for, this Fibonacci level has acted as a stiff resistance and the failure swings have evidenced the price drops to the current 1213 levels (refer monthly charts).
On daily charts, the shooting star is occurred at 1255.65 levels. The current prices are attempting to slide below 7DMAs, historically, it has slid at the same juncture, and selling momentum now seems to be intensifying, while both leading and lagging oscillators are in conformity to the selling pressures.
RSI and stochastic curves are converging to the price spikes to indicate the strong selling momentum.
While current prices on daily timeframe has consistently been sliding below DMAs, MACD on the other hand evidences indecisiveness.
Any abrupt dip, next strong immediate support is seen at 1242 region and 1233 (i.e.21DMA).
For an intraday speculation, we advocate buying boundary binaries, on an intraday trading perspective, boundary binary barriers with upper strikes at 1257 and lower strikes at 1242.
The trading between these strikes likely to derive certain yields in this puzzling trend and more importantly these yields are exponential from spot movements.
For cash or nothing, these options would be exercised if the forward prices to remain between both strikes (i.e. 1242 > Fwd price > 1257).


