


 BTC’s Bear Bounce: Sell the Rally Near $66K as Bears Target $59K–$52K Breakdown
  FxWirePro: EUR/ NZD uptrend loses steam, remains on bullish path
  FxWirePro: USD/ZAR edges higher, set to stay on back foot
  Geopolitical Easing Fuels AUDJPY Rally Toward 115 — Buy Dips at 113
  FxWirePro: GBP/AUD runs out of steam but maintains bullish outlook
  Ethereum Cracks Under $1,700: Sell the Rally Near $1,750 as Bears Eye $1,380–$1,200
  FxWirePro- Major Crypto levels and bias summary
  GBPJPY Coil Tightens: Is a Bullish Break Above 215.60 Imminent?
  FxWirePro: USD/JPY gains above 160 level ahead of BOJ policy meeting
  FxWirePro: AUD/USD climbs as US-Iran peace deal sparks risk rally
  FxWirePro- Woodies pivot (Major)
  Sell the Bounce: NZDJPY Bearish Bias Persists Below 94.20, Eyes 90.50
  FxWirePro: GBP/NZD stuck in range but outlook is bullish


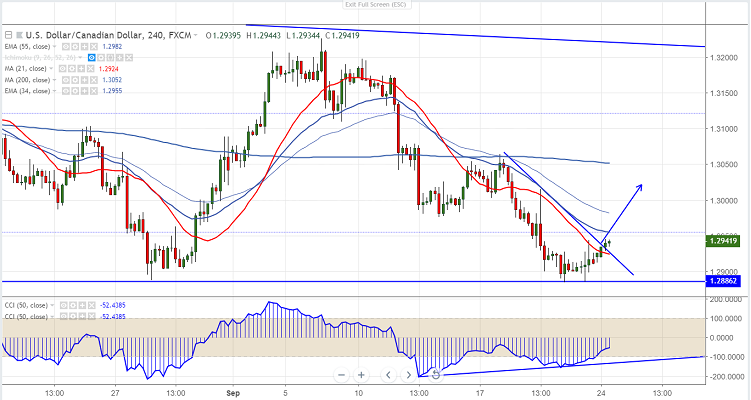
Chart pattern - Double Bottom
USDCAD has shown a minor jump of more than 50 pips from the low of 1.28843. It has formed almost a double bottom at 1.2880 and any further weakness only below that level.
On the higher side, near term resistance is around 1.29558 and any break above will take the pair to next level till 1.2980 (55- 4H EMA)/1.3000/1.30154 (Sep 19th high).
Oil prices jumped sharply almost 2% till $72 on Iran sanctions and global oil supply. It is trading above $72 and a jump till 74 is likely. The sudden jump in oil price is supporting Canadian dollar.
The near term major support is around 1.2880 and any break below will drag the pair down till 1.2845/1.2800.
It is good to buy on dips around 1.2930-325 with SL around 1.2880 for the TP of 1.2980/1.3015.


