


 FxWirePro: EUR/CAD gains ground on prospects of resumed energy flows
  Ethereum Consolidates: Bullish Technicals Point to a Potential $3,000 Breakout
  FxWirePro- Major Pair levels and bias summary
  FxWirePro: GBP/NZD down trend loses steam, remains on bearish path
  FxWirePro: GBP/USD bulls remain cautiously optimistic
  FxWirePro- Major Crypto levels and bias summary
  FxWirePro: USD/CAD recovers slightly but bearish outlook persists
  FxWirePro: USD/ZAR recovers slightly but trend is still bearish
  NZDJPY Bulls Charge Toward 95.00: Safe-Haven Exodus Drives Kiwi Rally
  FxWirePro: GBP/NZD up trend gains some momentum but hurdles ahead
  FxWirePro: USD/CNY neutral in the near-term, scope for downward resumption
  FxWirePro- Woodies Pivot(Major)
  FxWirePro- Major European Indices
  FxWirePro- Major Pair levels and bias summary
  FxWirePro:NZD/USD uptrend loses momentum but bullish setup remains
  FxWirePro: GBP/AUD positions for another drop, eyes 1.8900level
  FxWirePro: AUD/USD retreats slightly but trend is still bullish


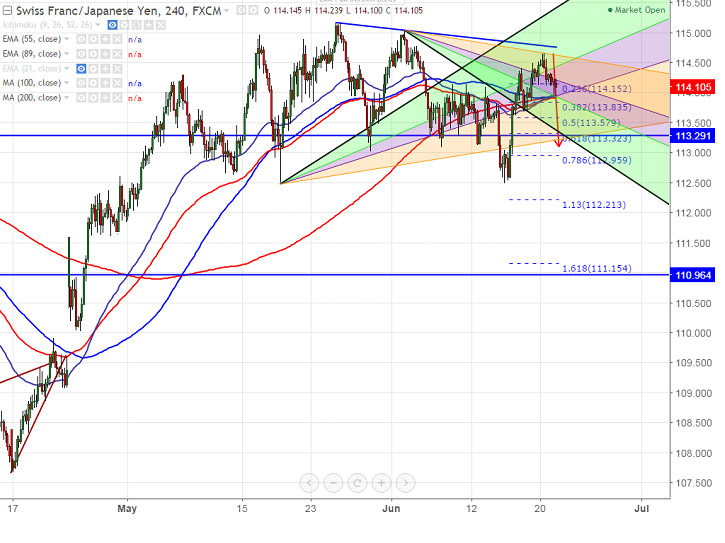
- The pair has shown a huge jump from the low of 112.50 formed on Jun 14th 2017. The pair jumped till 114.66 near to trend line resistance and shown a minor dip from that level. It is currently trading around 114.11.
- The major trend line resistance is around 114.73 (trend line joining 115.16 and 115.04) and any break above confirms further bullishness, a jump till 155.38/116.59 (161.8% retracement of 115.03 and 112.50).
- On the lower side, near term support in 4hour chart is around 113.90 (200- HMA) and any break below 113.57 (50% retracement of 114.66 and 112.50)/113.08.
It is good to sell on rallies around 114.20-114.25 with SL around 115 for the TP of 113.10/112.55.


