


 JPY Action Bias: USDJPY Emerges as the Clear Bullish Pair to Watch Amid Mixed Crosses
  FxWirePro: GBP/AUD downside pressure builds, key support level in focus
  Crypto Action Bias: ETHUSD Stands Out as the Bullish Pair to Watch
  FxWirePro: USD/ CNY remains soft ahead of Fed decision
  Major Forex Pairs Action Bias: GBPUSD and AUDUSD Turn Extremely Bearish
  FxWirePro: GBP/USD edges higher as traders await BoE guidance and UK fiscal clarity
  FxWirePro: GBP/NZD maintains bersish bias with focus on 2.2900 level
  FxWirePro: USD/ZAR retreats but trend is still bullish
  AUDJPY Weakness Deepens: Sell Rallies Toward 112 as Aussie Dollar Falters
  FxWirePro: EUR/AUD outlook weaker on renewed downside pressure
  Major Pairs Action Bias: USDCAD and USDCHF Stand Out as Extremely Bullish While GBPUSD and NZDUSD Turn Extremely Bearish
  FxWirePro: AUD/USD falls after softer-than-expected Australian Q2 CPI
  EUR/USD Bounces from Monthly Low, But Bearish Pressure Remains
  FxWirePro: USD/JPY eases ahead of Fed decision , Intervention risks linger
  NZDJPY Pullback: Sell Rallies Toward 93.30 as Yen Weakness Eases
  FxWirePro: NZD/USD neutral in the near-term, scope for downward resumption


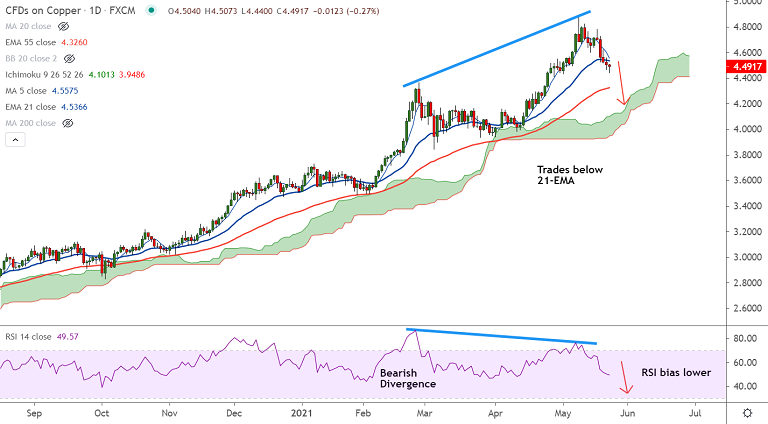
COPPER chart - Trading View
Copper edges higher from fresh 3-week lows at 4.44 hit earlier on the day and was trading at 4.4937 at around 11:00 GMT.
Price action has slipped below 21-EMA and a bearish 5-DMA crossover on 20-DMA adds to bearish bias.
MACD supports downside with a bearish crossover on signal line. Price action is below 200H MA.
Momentum indicators are bearish. Stochs and RSI are biased lower and RSI has slipped below 50 mark.
'Bearish RSI Divergence' on the daily charts adds to the downside pressure. Scope for further weakness.
Major trend still remains bullish. Copper price are on track to test 55-EMA at 4.3260. Further weakness only on break below.


