


 Major FX Action Bias & US Market Sentiment: NZD/USD (Extremely Bullish) & AUD/USD (Bullish) Watchlist
  Wall Street Analysts Weigh in on Latest NFP Data
  China's Refining Industry Faces Major Shakeup Amid Challenges
  Fed May Resume Rate Hikes: BofA Analysts Outline Key Scenarios
  Energy Sector Outlook 2025: AI's Role and Market Dynamics
  FxWirePro:EUR/NZD gains some upside momentum but still bearish
  Geopolitical Shocks That Could Reshape Financial Markets in 2025
  FxWirePro: GBP/NZD remains weak, eyes 38.2%fib support
  S&P 500 Relies on Tech for Growth in Q4 2024, Says Barclays
  FxWirePro: USD/JPY edges higher as focus shifts to BOJ decision
  FxWirePro : GBP/NZD strongly bearish despite upside attempts
  JPY Action Bias: EURJPY and CADJPY Emerge as Extremely Bullish Pairs to Watch
  FxWirePro: GBP/AUD drifts lower after BOE rate decision
  US Gas Market Poised for Supercycle: Bernstein Analysts
  AUD/JPY Slips Below 112 as BOJ Intervention Sparks Bearish Momentum: Sell the Rallies
  FxWirePro- Woodies pivot (Major)
  Nikkei Surges Past 65,000 on Suspected Yen Weakness: Tech Giants Like Advantest and NEC Lead Explosive Gains


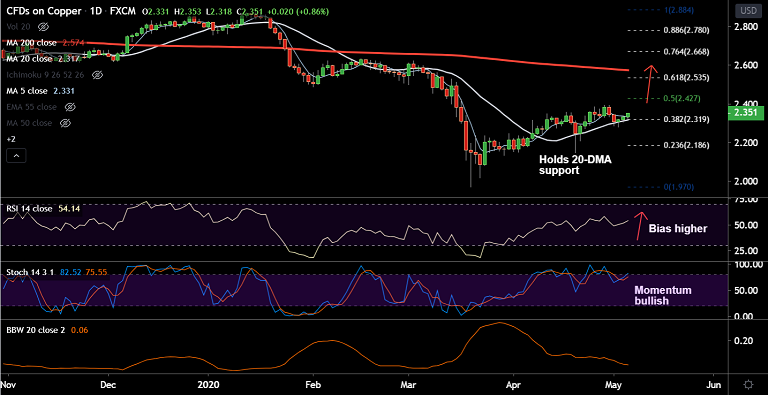
Copper chart - Trading View
Copper was trading 1.25% higher on the day at 2.359 at around 11:30 GMT.
Price is extending upside for the 3rd straight session, bias is turning bullish.
The pair is extending upside in a 'Rising Channel' pattern and has bounced off 20-DMA support.
Technical indicators are supporting gains. RSI is above 50 and biased higher. Momentum with the bulls.
The pair has broken above 50-DMA and is testing 55-EMA resistance. Price action is above 200H MA.
Volatility is rising on the intraday charts, scope for further upside. 55-EMA is immediate resistance at 2.370.
Next major hurdle above 55-EMA aligns at 50% Fib at 2.427 ahead of channel top at 2.480.
20-DMA is strong support at 2.318. Break below will negate any bullish bias.


