


 Major Forex Pairs Action Bias: GBPUSD and AUDUSD Turn Extremely Bearish
  FxWirePro- Woodies pivot (Major)
  NZDJPY Pullback: Sell Rallies Toward 93.30 as Yen Weakness Eases
  JPY Pairs Action Bias: EURJPY Leads as Bullish Standout Amid Mixed Momentum
  FxWirePro: EUR/ AUD gains some ground , but remains on bearish path
  FxWirePro: NZD/USD edges lower, remains on back foot
  FxWirePro: USD/CAD runs out of steam but maintains bullish outlook
  EUR/USD Bounces from Monthly Low, But Bearish Pressure Remains
  FxWirePro- Major Pair levels and bias summary
  Major Pairs Action Bias: USDCAD and USDCHF Stand Out as Extremely Bullish While GBPUSD and NZDUSD Turn Extremely Bearish
  FxWirePro: USD/ZAR retreats but trend is still bullish
  FxWirePro: EUR/NZD up trend gains momentum but hurdles ahead
  FxWirePro: GBP/NZD gains some ground but bias is still bearish
  FxWirePro : USD/JPY holds relatively bid on 163 ahead Of FOMC,BoJ meetings
  FxWirePro: GBP/NZD maintains bersish bias with focus on 2.2900 level
  EUR/JPY Holds Bullish Bias as Euro Extends Recovery


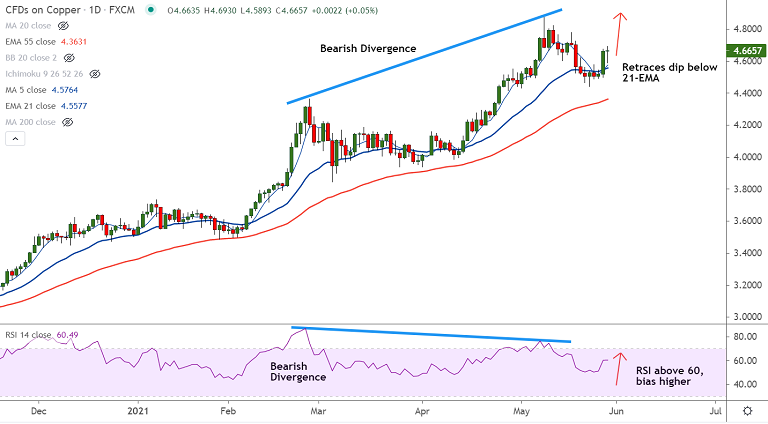
COPPER chart - Trading View
Copper was trading 0.20% lower on the day at 4.6538 at around 15:50 GMT.
Stronger dollar weighed on the commodities market, dragging copper price lower.
The pair hit session lows at 4.5893 before paring losses and edging higher.
Bearish RSI divergence led dip found support at 21-EMA. RSI has turned bullish above 60 mark.
Copper prices have retraced a brief dip below 21-EMA and have edged above 5-DMA.
GMMA indicator shows major trend is strongly bullish and minor trend is turning bullish.
Copper price are set to resume upside after brief pullback. Retest of yearly highs at 4.8857 likely.


