


 FxWirePro- Major Pair levels and bias summary
  FxWirePro: EUR/ AUD gains some ground , but remains on bearish path
  FxWirePro: EUR/NZD up trend gains momentum but hurdles ahead
  FxWirePro: USD/JPY eases ahead of Fed decision , Intervention risks linger
  FxWirePro: GBP/NZD gains some ground but bias is still bearish
  FxWirePro: USD/ CNY remains soft ahead of Fed decision
  EUR/USD Bounces from Monthly Low, But Bearish Pressure Remains
  FxWirePro: USD/ZAR retreats but trend is still bullish
  FxWirePro: NZD/USD neutral in the near-term, scope for downward resumption
  FxWirePro: AUD/USD dips after RBA Governor speech
  FxWirePro- Woodies pivot (Major)
  FxWirePro: GBP/USD edges higher as traders await BoE guidance and UK fiscal clarity
  FxWirePro: GBP/NZD maintains bersish bias with focus on 2.2900 level
  JPY Pairs Action Bias: EURJPY Leads as Bullish Standout Amid Mixed Momentum
  EUR/JPY Holds Bullish Bias as Euro Extends Recovery
  AUDJPY Weakness Deepens: Sell Rallies Toward 112 as Aussie Dollar Falters


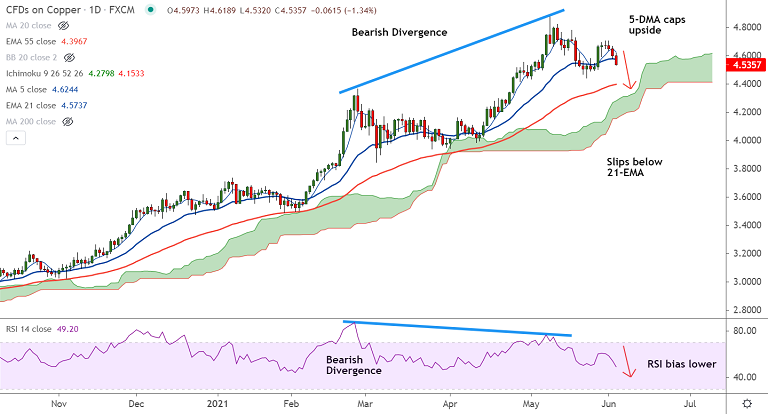
COPPER chart - Trading View
Technical Analysis: Bias Bearish
- Copper slumps over 1.40% on the day, outlook bearish
- Price action has breached 21-EMA support
- RSI has slipped below 50 mark, bias lower
- Bearish RSI divergence on the daily charts keeps downside bias
- 5-DMA has turned and caps upside in the pair at 4.623
- The pair trades below 200H MA and volatility is high on the intraday charts
Support levels - 4.452 (Lower BB), 4.396 (55-EMA), 4.279 (cloud top)
Resistance levels - 4.570 (21-EMA), 4.618 (5-DMA), 4.629 (20-DMA)
Summary: Copper is on track to extend pullback. Scope for test of 55-EMA at 4.395.


