


 FxWirePro: AUD/USD falls after softer-than-expected Australian Q2 CPI
  EUR/JPY Holds Bullish Bias as Euro Extends Recovery
  Major Forex Pairs Action Bias: GBPUSD and AUDUSD Turn Extremely Bearish
  FxWirePro- Major Pair levels and bias summary
  FxWirePro: GBP/USD edges higher as traders await BoE guidance and UK fiscal clarity
  FxWirePro: EUR/ AUD gains some ground , but remains on bearish path
  JPY Action Bias: USDJPY Emerges as the Clear Bullish Pair to Watch Amid Mixed Crosses
  NZD/JPY Flatlines Near 94.60: Will Key Support Reignite the Uptrend?
  FxWirePro: NZD/USD edges lower, remains on back foot
  FxWirePro: AUD/USD dips after RBA Governor speech
  FxWirePro: USD/ CNY remains soft ahead of Fed decision
  FxWirePro: GBP/NZD maintains bersish bias with focus on 2.2900 level
  FxWirePro: USD/JPY eases ahead of Fed decision , Intervention risks linger
  EUR/USD Bounces from Monthly Low, But Bearish Pressure Remains
  NZDJPY Pullback: Sell Rallies Toward 93.30 as Yen Weakness Eases
  FxWirePro: GBP/AUD downside pressure builds, key support level in focus


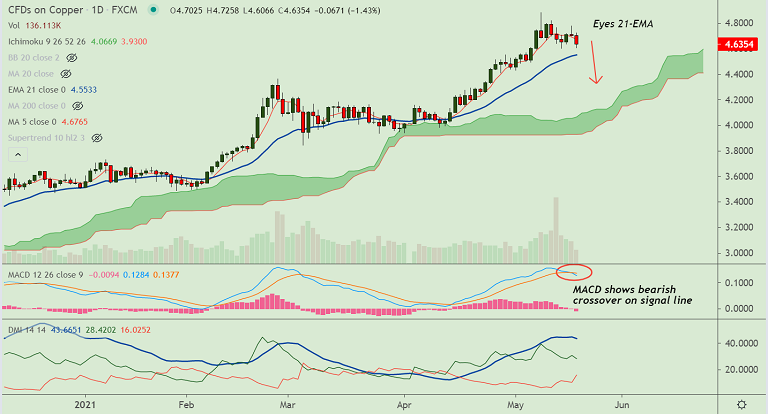
COPPER chart - Trading View
Copper dived over 2.35% on the day to hit 9-day low at 4.585 at around 11:20 GMT.
The pair is set to extend downside as price action slips below 200H MA.
Technical indicators have turned bearish, Stochs and RSI have rolled over from overbought levels and are biased lower.
The pair is extending weakness after Gravestone Doji formation in the previous session.
MACD confirms a bearish crossover on signal line adding to the bearish bias. 5-DMA is biased lower.
Price action has shown a decisive break below 200H MA, scope for further downside. Copper is on track to test 21-EMA at 4.549.


