


 FxWirePro: AUD/USD dips after RBA Governor speech
  JPY Action Bias: USDJPY Emerges as the Clear Bullish Pair to Watch Amid Mixed Crosses
  FxWirePro: USD/ CNY remains soft ahead of Fed decision
  FxWirePro- Woodies pivot (Major)
  FxWirePro : USD/JPY holds relatively bid on 163 ahead Of FOMC,BoJ meetings
  AUDJPY Weakness Deepens: Sell Rallies Toward 112 as Aussie Dollar Falters
  FxWirePro: EUR/NZD up trend gains momentum but hurdles ahead
  FxWirePro: USD/ZAR retreats but trend is still bullish
  FxWirePro: NZD/USD neutral in the near-term, scope for downward resumption
  FxWirePro: EUR/ AUD gains some ground , but remains on bearish path
  Crypto Action Bias: ETHUSD Stands Out as the Bullish Pair to Watch
  FxWirePro: NZD/USD edges lower, remains on back foot
  FxWirePro: GBP/NZD gains some ground but bias is still bearish
  FxWirePro: GBP/NZD maintains bersish bias with focus on 2.2900 level
  EUR/USD Bounces from Monthly Low, But Bearish Pressure Remains
  FxWirePro: AUD/USD falls after softer-than-expected Australian Q2 CPI


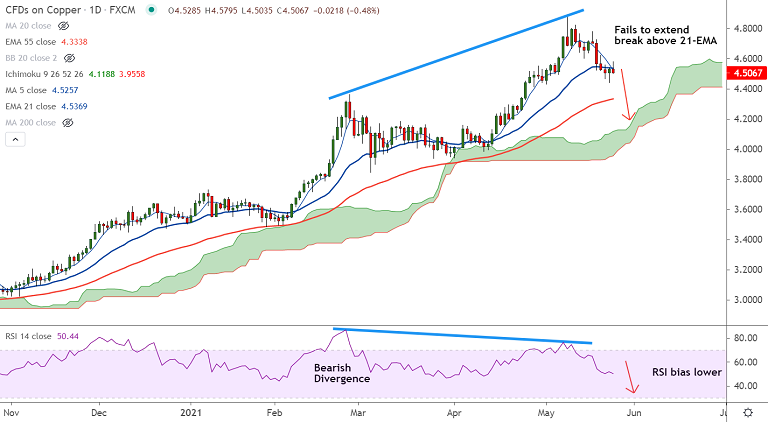
COPPER chart - Trading View
Copper erases early gains, slips lower from session highs at 4.5795 and was trading at 4.5087 at around 11:15 GMT.
The pair is struggling to hold break above 21-EMA. Bearish 5-DMA crossover on 20-DMA raises scope for downside.
Momentum indicators are bearish. Stochs and RSI are biased lower and RSI has slipped below 50 mark.
MACD supports downside with a bearish crossover on signal line. Price action is below 200H MA.
'Bearish RSI Divergence' on the daily charts adds to the downside pressure. Scope for further weakness.
Major trend still remains bullish, pullbacks are likely to be shallow. The pair is consolidating after 2 straight weeks of downside.
Copper price is extending choppy trade around 21-EMA. Prices are on track to test 55-EMA at 4.3341. Major weakness only on break below.


