


 FxWirePro: GBP/NZD maintains bersish bias with focus on 2.2900 level
  EUR/USD Bounces from Monthly Low, But Bearish Pressure Remains
  FxWirePro: GBP/USD edges lower ahead of Fed policy verdict
  Major Forex Pairs Action Bias: GBPUSD and AUDUSD Turn Extremely Bearish
  Crypto Action Bias: ETHUSD Stands Out as the Bullish Pair to Watch
  Buy the Dips on EUR/JPY: Bullish Structure Points to 188 Target Ahead of Fed
  FxWirePro: AUD/USD falls after softer-than-expected Australian Q2 CPI
  FxWirePro: USD/ZAR firms ahead of Fed interest rate decision
  JPY Pairs Action Bias: EURJPY Leads as Bullish Standout Amid Mixed Momentum
  FxWirePro: USD/JPY eases ahead of Fed decision , Intervention risks linger
  FxWirePro: USD/CAD runs out of steam but maintains bullish outlook
  NZD/JPY Flatlines Near 94.60: Will Key Support Reignite the Uptrend?
  AUDJPY Weakness Deepens: Sell Rallies Toward 112 as Aussie Dollar Falters
  FxWirePro- Major Pair levels and bias summary
  FxWirePro: USD/ZAR retreats but trend is still bullish


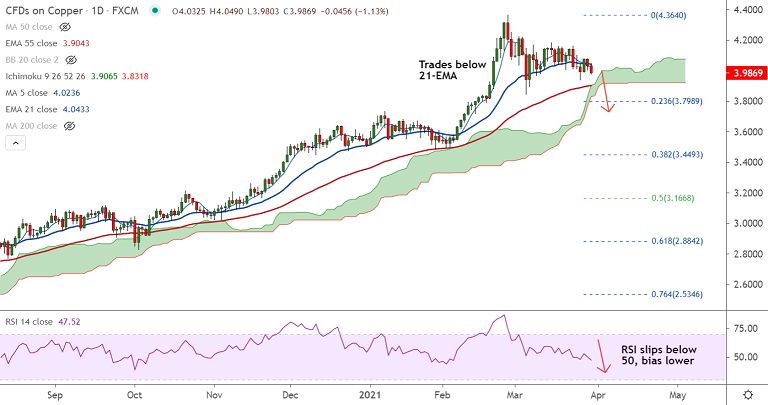
COPPER chart - Trading View
Copper was trading 1.10% lower on the day at 3.988 at around 11:35 GMT, extending previous session's weakness.
Price action has failed to extend recovery above 21-EMA which is now turned stiff resistance at 4.043.
The pair is grinding lower for the 3rd straight week, technical studies keep scope for further downside.
5-week MA has turned South and price action has slipped below 200H MA on the intraday charts.
Oscillators show bearish momentum and RSI is below 50 which supports bearish momentum.
Bears now eye next major support at 3.904 (nearly converged 55-EMA and daily cloud top).
Major trend still remains bullish. Breach below cloud will change near-term dynamics.
Support levels - 3.904 (nearly converged 55-EMA and daily cloud top), 3.798 (23.6% Fib)
Resistance levels - 4.043 (21-EMA), 4.061 (200H MA), 4.084 (5-week MA)


