


 FxWirePro- Woodies pivot (Major)
  FxWirePro: GBP/AUD bears maintain upper hand
  FxWirePro- Major Pair levels and bias summary
  FxWirePro: AUD/USD gains some ground but outlook is bearish
  NZDJPY Bullish Rebound: Buy Dips as EMAs Align for 97 Target
  FxWirePro: GBP/USD rises as soft US data pressures dollar
  US Magnificent 7 Stocks Trend Score: Amazon & Microsoft Hit Extreme Bullish (+100) as Meta Drops to -100 — Key Resistance & Support Watchlist
  FxWirePro: GBP/AUD drifts lower after BOE rate decision
  FxWirePro: USD/ZAR gains as stronger dollar outweighs upbeat South Africa's trade surplus
  Nikkei Surges Past 65,000 on Suspected Yen Weakness: Tech Giants Like Advantest and NEC Lead Explosive Gains
  US Magnificent 7 Stocks Trend Score: Amazon & Microsoft Hit Extreme Bullish (+100) as Meta Drops to -100 — Key Resistance & Support Watchlist
  Major European Indices Score Extremely Bullish: DAX Eyes 26000, CAC Targets 8600, FTSE100 at 11000 – Key Levels to Watch
  FxWirePro: NZD/USD consolidates overnight gains, but loses momentum
  Major FX Action Bias & US Market Sentiment: NZD/USD (Extremely Bullish) & AUD/USD (Bullish) Watchlist
  FxWirePro: GBP/NZD remains weak, eyes 38.2%fib support
  FxWirePro- Woodies pivot (Major)


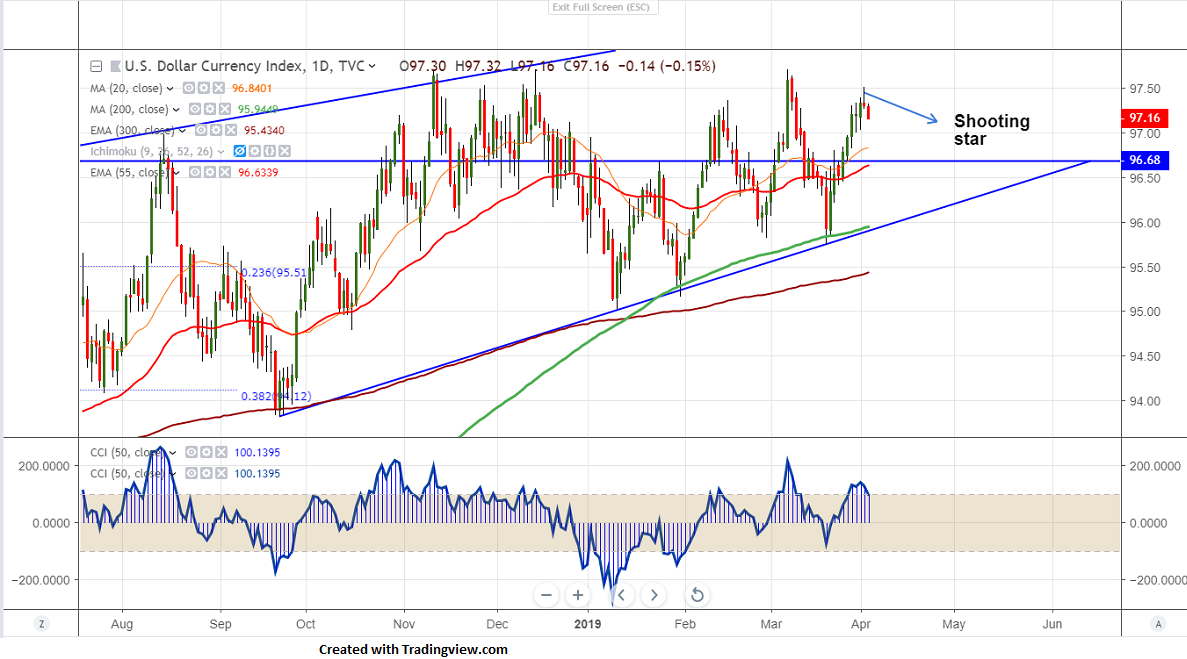
Candlestick pattern- Shooting star
DXY has once again lost nearly 30 pips after hitting high of 97.52. The index has formed temporary top around 97.71 on Mar 7th 2019 and lost nearly 200 pips from that level till 95.74. It was trading higher for past 3 week on account of declining bond yield and yield curve inversion.US Durable goods order declined unexpectedly and tumbled -1.6% in Feb compared to forecast of -1.1%.It is currently trading around 97.16.
The near term support is around 96.77 (20- day MA) and any violation below will take the index to next level till 96.55 (55- day EMA)/96.36.Any break below 95.74 low made on Mar 20th confirms further weakness.
On the higher side, near term resistance is at 97.40 and any break above continues to reach 97.71 high made on Mar 7 almost a double top .Any break above 97.71 confirms bullish continuation.
It is good to sell on rallies around 97.35-40 with SL around 97.71 for the TP of 96.36


