


 Bitcoin Resilience: BTC Reclaims USD 69,000 as Geopolitical Tensions Ease
  FxWirePro- Major Crypto levels and bias summary
  FxWirePro: EUR/ NZD consolidating around 2.0200, room for further gains
  FxWirePro- Major European Indices
  Euro Retreats as Geopolitical Tensions Surge: EURUSD Eyes 1.1400 Floor Amid Safe-Haven Demand
  FxWirePro: EUR/ NZD consolidating around 2.0180 room for further gains
  FxWirePro: GBP/NZD remains buoyant, looks to extend gains
  Kiwi Under Pressure: NZDJPY Signals Bearish Turn as Resistance at 92.00 Holds Firm
  Pound Under Pressure as Yen Stabilizes: GBPJPY Bears Target 208 as Key EMAs Hold Resistance
  FxWirePro: AUD/USD recovers slightly from early decline but bears are not done yet
  FxWirePro- Major Crypto levels and bias summary
  FxWirePro: GBP/NZD edges up, remains on front foot
  Ethereum Joins the Rally: ETH Reclaims USD 2,100 Following Bitcoin's Lead
  FxWirePro- Woodies Pivot(Major)
  FxWirePro:NZD/USD remains vulnerable as Trump's latest deadline leaves investors on edge


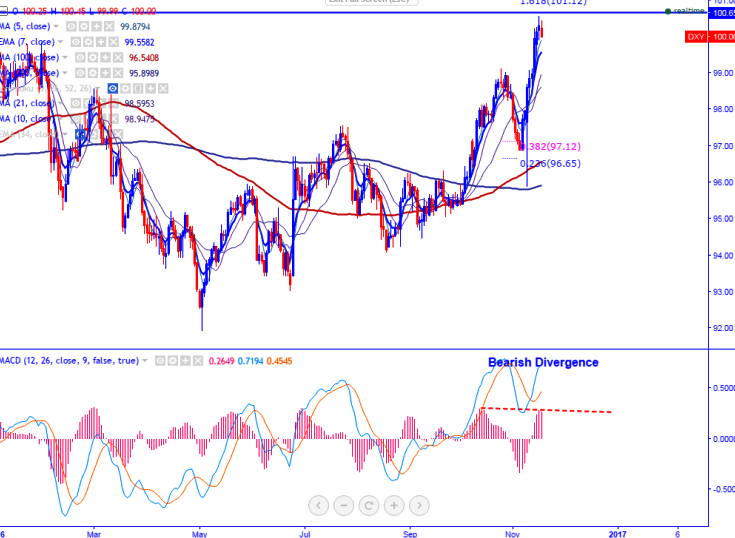
- Major resistance - 101.12 (161.8% retracement of 99.12 and 95.89).
- Pattern formed – Bearish Divergence
- The U.S dollar index has made a high of 100.57 and slightly declined from that level. It is currently trading around 100.
- In the daily chart the index has formed bearish divergence, so a slight decline till 98.66 (10- day MA)/98 is possible.
- On the higher side, any break above 100.60 will take the pair till 101.12 (161.8% retracement of 99.12 and 95.89)/102.
It is good to sell on rallies around 100.10-100.20 with SL around 101.12 for the TP of 98.65/98.05
Resistance
R1-100.60
R2-101.15
R3-102
Support
S1-99
S2-98.65.
S3- 98


