


 FxWirePro- Major Crypto levels and bias summary
  FxWirePro- Major Crypto levels and bias summary
  FxWirePro- Major Crypto levels and bias summary
  Ethereum Cracks Below $2,000 as Bitcoin Contagion Bites—Bearish EMA Stack Sets Sights on $1,700
  FxWirePro- Major Crypto levels and bias summary


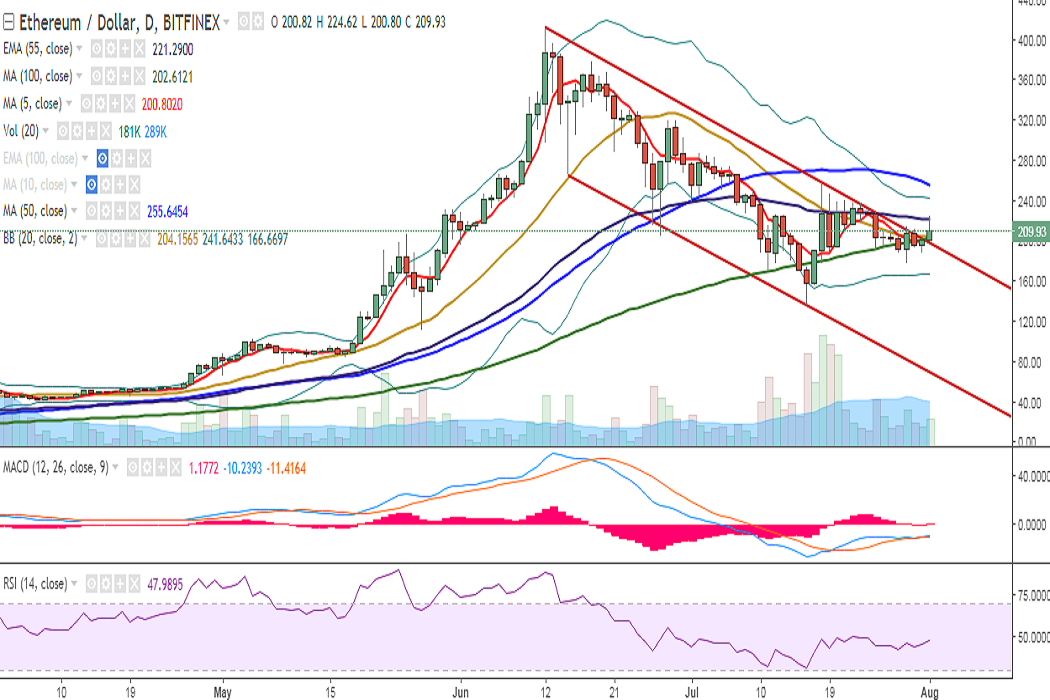
ETH/USD ran into resistance at 55-EMA earlier in the day and is currently trading at 210 levels at the time of writing (Bitfinex).
Ichimoku analysis (Daily chart):
Tenkan-Sen: 204.75
Kijun-Sen: 200.96
On the upside, a consistent break above 221 (55-EMA) would see the pair targeting 255 (50-DMA)/ 306 (61.8% retracement of 412.21 and 136.12). Further strength would see it testing 353/377 (June 18 high)/412 (June 12 high).
On the reverse side, a break below 197 (trend line joining 412.21 and 258) would drag it to 175 (78.6% retracement of 110.42 and 412.21)/166 (1w 20-SMA). Further weakness would drag it to 136 (July 16 low)/114 (200-DMA)/69 (trend line joining 265 and 136).
Momentum studies: Bias appears slightly bearish on the daily chart with RSI at 47, and stochs biased lower (slow stochastic showing more downside possibility).
On the weekly chart, RSI is at 57 and a slight change in bias of stochs could be seen. However, MACD line is below the signal line.
Recommendation: Good to go short on break below 197. SL: 255. TP: 166/136.
FxWirePro launches Absolute Return Managed Program. For more details, visit http://www.fxwirepro.com/invest

- News

- Economy

- Central Banks
- Investing
- Research
- Roundups
- Digital Currency
- Insights
- Technical Analysis
- Technology
- Business
- Law
- Health
- Nature
- Fintech
- Science
- Topic
- Opinions
- ©Econometrics LLC . All Rights Reserved.
FxWirePro: ETH/USD faces resistance at 55-EMA, good to go short on break below 197
Tuesday, August 1, 2017 11:57 AM UTC
Editor's Picks


- Market Data
Most Popular


