


 Ethereum Tumbles Below $2K: Bears Eye $1,700 as All Key EMAs Flip Red
  Bitcoin Cracks $75K as $1.3B ETF Exodus and Middle East Jitters Spook Bulls; Bears Eye $70K
  FxWirePro- Major Crypto levels and bias summary
  ETH Cracks $2,100 in Bitcoin’s Wake as Bearish EMA Stack Deepens; Sellers Target $1,900 on Rallies
  FxWirePro- Major Crypto levels and bias summary


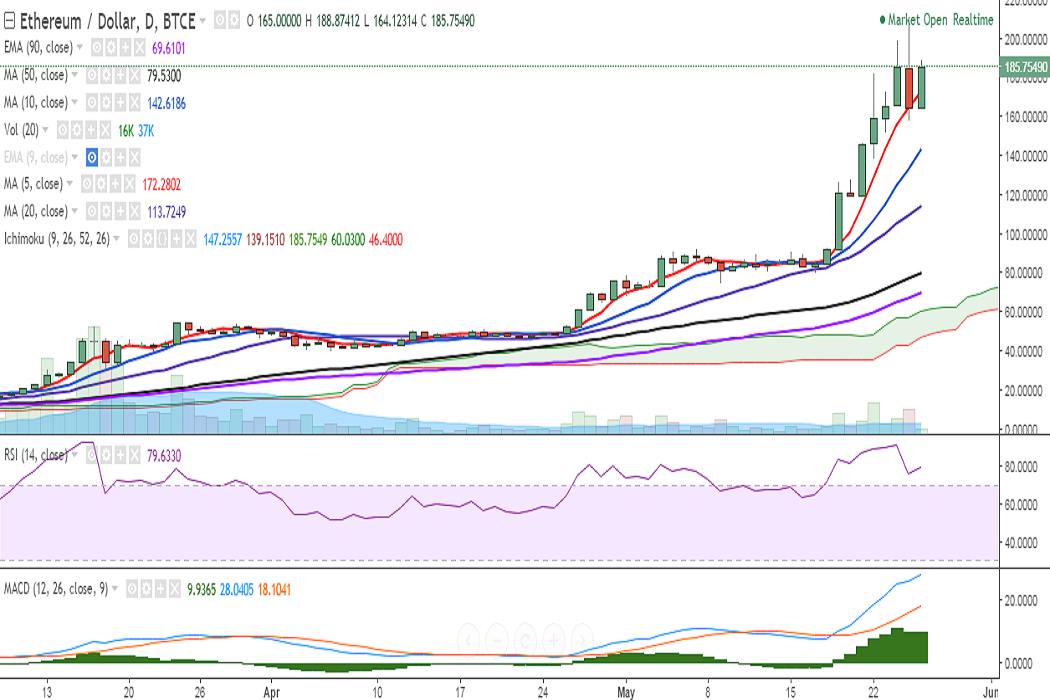
ETH/USD dropped to 158 levels on May 25 after it hit a fresh all-time high of 210 levels. The pair resumed its uptrend on Friday and is currently trading at 186 levels at the time of writing (BTC-e).
Ichimoku analysis (Daily chart):
Tenkan-Sen: 132.45
Kijun-Sen: 124.93
The pair is struggling to close above the 200-mark and a decisive break above would see it testing 210 (May 25 high)/232 (113% extension of 40.12 and 210)/256.
On the downside, support is seen at 172 (5-DMA). A bearish Stoch divergence could be seen on daily charts. This coupled with a close below 5-DMA would see minor bearishness in the pair, dragging it to 142.54 (10-DMA).
On the hourly charts, bearish divergence could be seen on MACD and RSI. Also, Bollinger bands are narrowing suggesting an upcoming change in trend.

- News

- Economy

- Central Banks
- Investing
- Research
- Roundups
- Digital Currency
- Insights
- Technical Analysis
- Technology
- Business
- Law
- Health
- Nature
- Fintech
- Science
- Topic
- Opinions
- ©Econometrics LLC . All Rights Reserved.
FxWirePro: ETH/USD finds strong support at 5-DMA, close below targets 142
Friday, May 26, 2017 10:53 AM UTC
Editor's Picks


- Market Data
Most Popular


