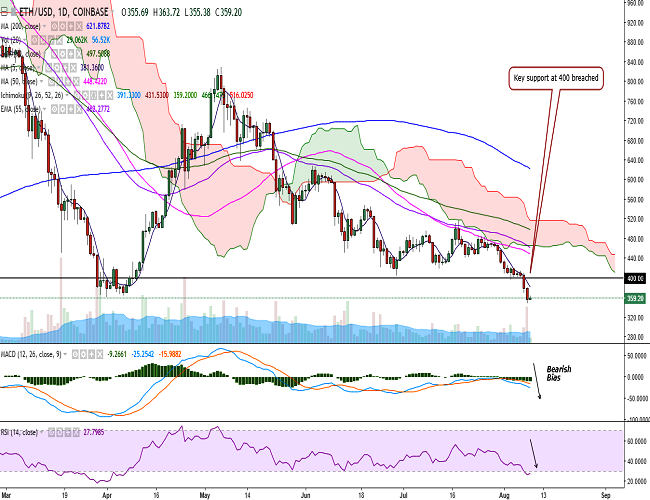
(Refer ETH/USD chart on Trading View)
ETH/USD dropped to 347 levels on Wednesday before closing at 355 levels (Coinbase).
The pair is currently trading in a narrow range around 360 levels at the time of writing.
On the topside, the pair faces resistance at 381 (5-DMA) and a break above would see it testing 399 (10-DMA)/431 (20-DMA)/448 (50-DMA).
On the downside, the pair is currently hovering around 361(1w 90-EMA) and a decisive break below would see it testing 349 (113% extension of 828.97 and 404.22)/333 (1w 100-SMA)/300.
Technical indicators are bearish on the daily chart with no major sign of reversal. However, there could be minor pullbacks as momentum indicators are in the oversold zone.
Overall bias remains bearish.
Call Update: We recommended staying short in our previous call. The pair has hit TP1.
Recommendation: Book partial profits, stay short. SL: 400. TP: 335/300.