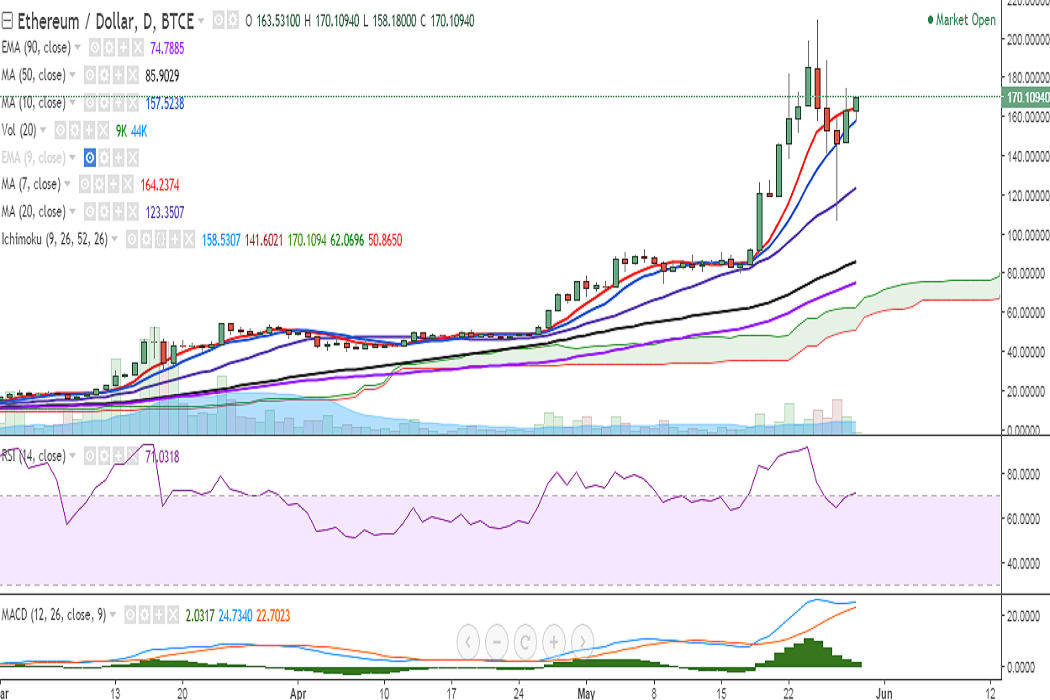
ETH/USD is hovering around 61.8% fib on Monday, recovering from the low of 107 levels hit on May 27. It is currently trading at 170 levels at the time of writing (BTC-e).
Ichimoku analysis (Daily chart):
Tenkan-Sen: 158.53
Kijun-Sen: 141.60
Intraday bias appears bullish as RSI and stochs point higher on hourly charts. On the upside, immediate resistance is seen at 170.67 (61.8% retracement of 210 and 107) and a break above would target 187/210 (May 25 high).
On the daily chart, RSI is strong at 70, MACD line is above signal line, and stochs point higher.
On the downside, support is seen at 157.34 (10-DMA) and any violation would drag it to 142.50 (50% retracement of 75 and 210)/123 (20-DMA).