FxWirePro: ETH/USD struggles to close above 14 level, good to buy the dips
ETH/USD is seen trading in below in red on Tuesday. The pair has declined sharply after making a high of $13.82 (KRAKEN). It is currently trading around $13.36 at the time of writing. Ichimoku analysis of daily chart sho…
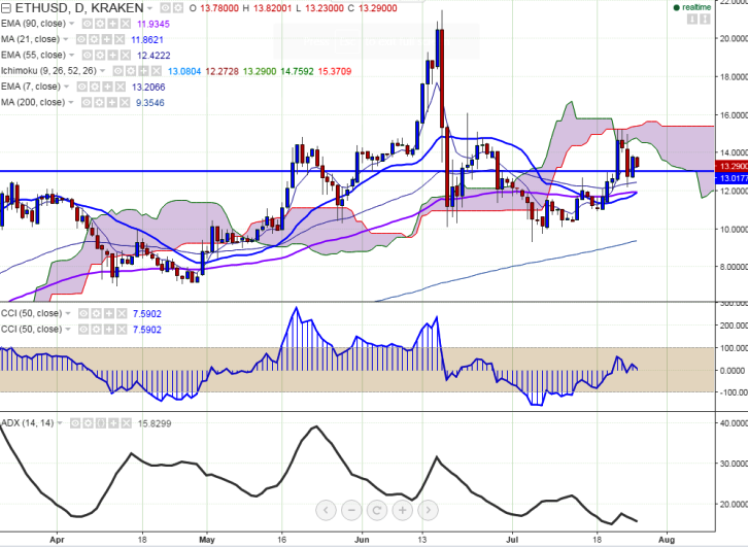
ETH/USD is seen trading in below in red on Tuesday. The pair has declined sharply after making a high of $13.82 (KRAKEN). It is currently trading around $13.36 at the time of writing.
Ichimoku analysis of daily chart shows:
Tenkan-Sen $13.08
Kijun-Sen $12.07
Trend reversal - $11.90
The long-term and short-term trend remains to be bullish. In the daily chart, the pair is facing psychological resistance at $14 and any close above confirms further bullishness.
Major resistance is seen at $14.08 (61.8% retracement of $15.23 and $12.20) and any break above targets $14.69 (cloud top)/$15.23. Major support can be noticed at $13.08 (daily Tenken-sen) and break below targets $12.39 (55 EMA)/$12.20 (Jul 24th low).