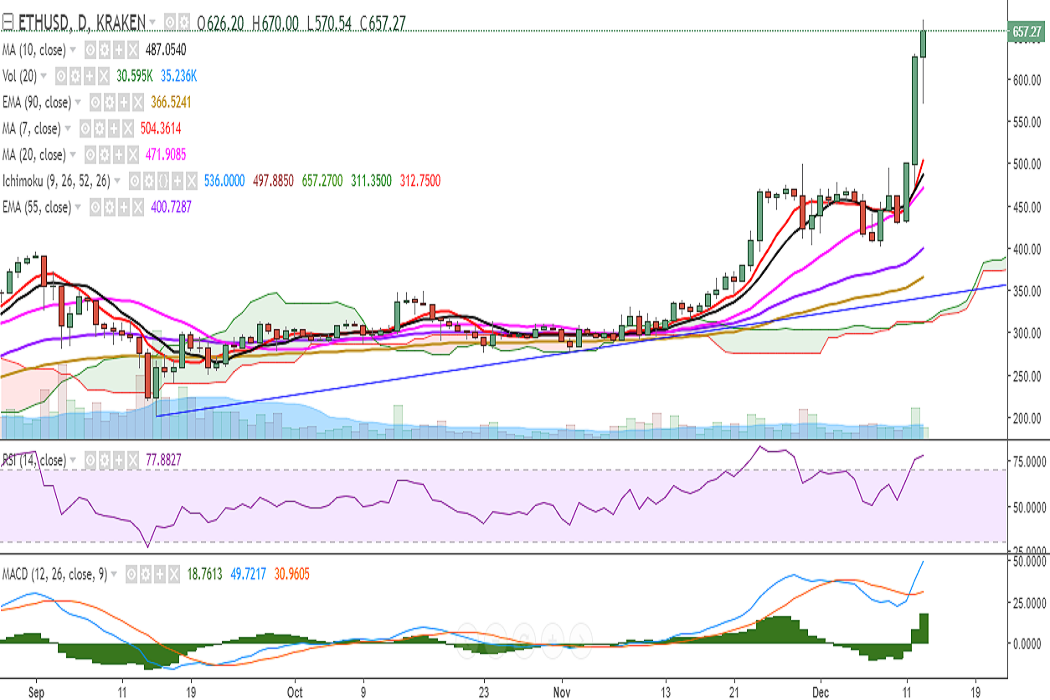
ETH/USD is trading higher on Wednesday as it soared past 600 levels. It is currently trading at 657 levels at the time of writing (Kraken).
Ichimoku analysis (Daily chart):
Tenkan-Sen: 468.06
Kijun-Sen: 428.81
On the upside, the pair is likely to face resistance at 682 (161.8% extension of 201.28 and 498.90) and a break above would see it testing 700/723 (161.8% extension of 134.78 and 498.90). Further strength would target 782/800.
On the downside, support is seen at 614 (1h 20-SMA) and any violation would drag the pair to 590 (4h 10-SMA)/548 (1h 50-SMA). Further weakness would target 505 (7-DMA)/487 (10-DMA)/472 (20-DMA).
Momentum studies: Bias is extremely bullish on the daily chart with RSI strong at 78, bullish MACD crossover, and stochs rolling over to overbought zone.
However, with the recent price surge, experts are predicting an imminent correction. That being said, there are no major signs of reversal on the daily chart at the time of writing.
The bearish RSI divergence on the 1h chart suggests some consolidation around current levels, but overall trend remains bullish.