


 FxWirePro- Major Crypto levels and bias summary
  BTC’s Bear Bounce: Sell the Rally Near $66K as Bears Target $59K–$52K Breakdown


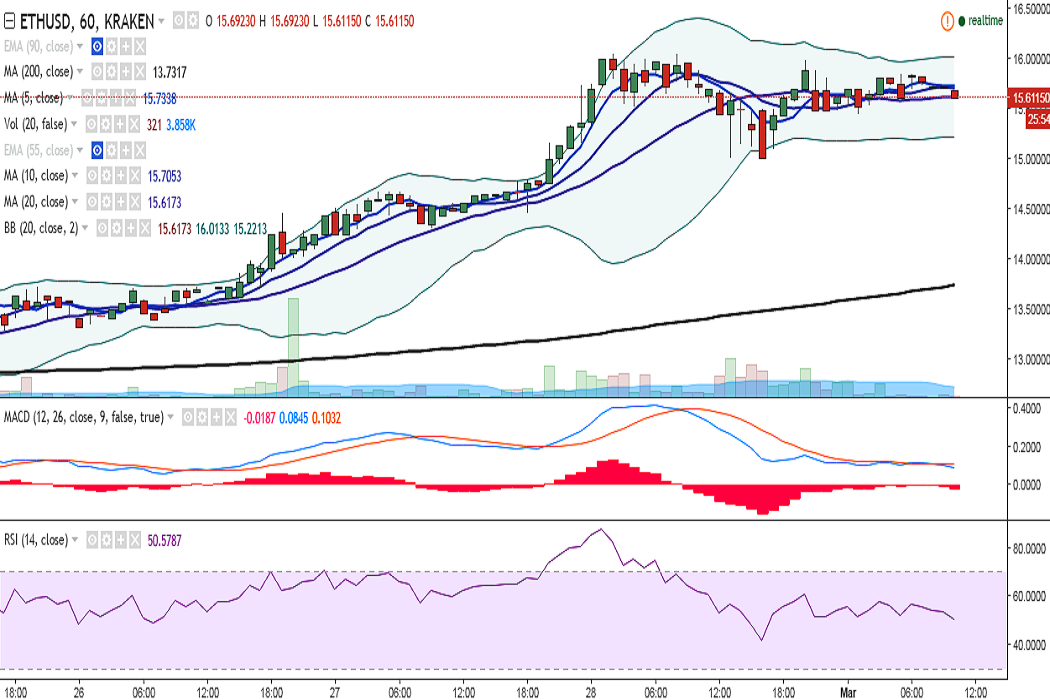
ETH/USD hit 16.06 levels on Tuesday, stopping just shy of 16.08 levels (22 June 2016 high) but failed to hold its strength and closed at 15.63 levels. It is currently trading at 15.73 levels at the time of writing (Kraken).
Ichimoku analysis (Daily chart):
Tenkan-Sen: 14.14
Kijun-Sen: 13.27
Overall bias remains bullish. On the upside, resistance is seen at 16.06 (Feb 28 high) and a break above would target 16.45 (113% retracement of 15.23 and 5.92). Further strength would see it testing 16.77 (127.2% retracement of 14.45 and 5.92)/ 17.
Some consolidation could be seen around current levels, and further upside on close above 16 levels. Intraday chart shows rangebound trading and 15.61 (1H 20-SMA) is acting as a strong support. A break below this levels would 15.22 (Lower Bollinger)/ 15 (psychological level)/ 14.74 (23.6% retracement of 10.48 and 16.05).

- News

- Economy

- Central Banks
- Investing
- Research
- Roundups
- Digital Currency
- Insights
- Technical Analysis
- Technology
- Business
- Law
- Health
- Nature
- Fintech
- Science
- Topic
- Opinions
- ©Econometrics LLC . All Rights Reserved.
FxWirePro: ETH/USD takes support near 1H 20-SMA, further upside on close above 16
Wednesday, March 1, 2017 10:37 AM UTC
Editor's Picks


- Market Data
Most Popular


