FxWirePro: ETH/USD trades flat, good to sell on rallies
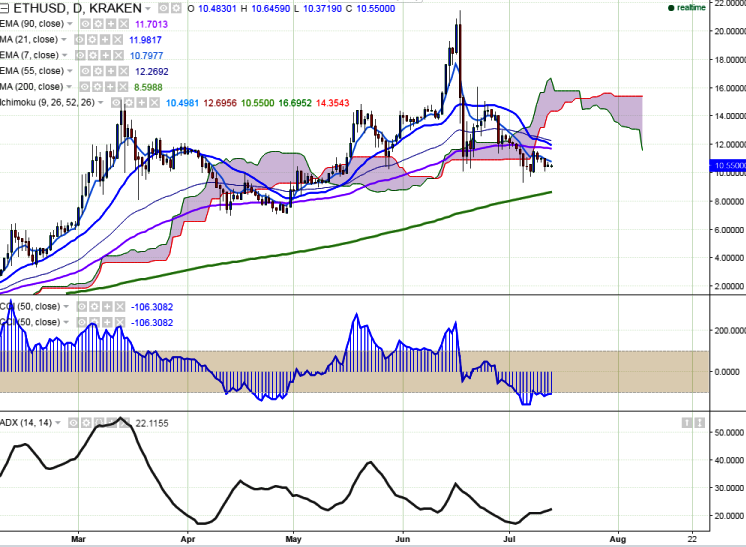
ETH/USD is seen trading flat in green on Wednesday. The pair is consolidating in a narrow range between $10.79 and $10.37 (KRAKEN) for the past two trading session. It is currently trading around $10.55 at the time of wr…
ETH/USD is seen trading flat in green on Wednesday. The pair is consolidating in a narrow range between $10.79 and $10.37 (KRAKEN) for the past two trading session. It is currently trading around $10.55 at the time of writing.
Ichimoku analysis of daily chart shows:
Tenkan-Sen $10.60
Kijun-Sen $15.39
Trend reversal - $11.72
Long-term trend remains to be bullish. The short term remains to be bearish. In the daily chart, the pair is facing resistance around $11.72 (55 days EMA) and it should break above for further bullishness.
Major resistance is seen at $10.88 (7 days EMA) and any break above confirms major bullishness, a jump till $11.75 (90 days EMA)/$12.11 (21 day MA). Major support can be notices at $10 and break below targets $9.30 (Jul 5th 2016 low)/ $8.45 (127.2% retracement of $10.10 and $16.08).
The swaps reference Trade.xyz perpetual futures on Hyperliquid. Clients can cross-margin real-world-asset swap exposures and use RLUSD as collateral, subject to jurisdictional availability.