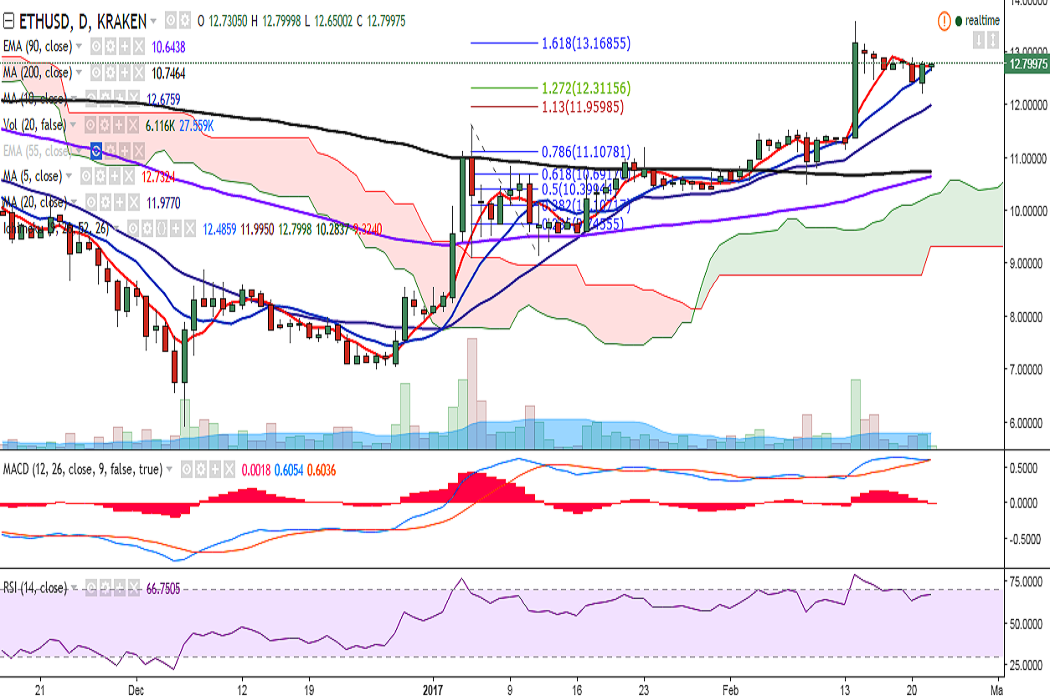
ETH/USD dropped to 12.22 levels on Tuesday before closing at 12.78 levels. It is currently trading at 12.69 levels at the time of writing (Kraken).
Ichimoku analysis (Daily chart):
Tenkan-Sen: 12.37
Kijun-Sen: 11.98
Overall bias appears to be bullish. On the upside, immediate resistance is seen at 12.91 (February 20 high) and a break above would test 13.16 (161.8% retracement of 11.63 and 9.16)/ 13.58 (February 14 high).
In the hourly chart, the pair has taken strong support near 12.66 (1H 200-SMA) and a break below could see further weakness in the pair.
In the daily chart, MACD appears to be on the verge of a bearish crossover. This coupled will the bearish crossover of 5- and 10-DMA (12.71 and 12.53 respectively) could be taken as a signal to go short till 20-DMA.
A break below 11.87 (20-DMA) would confirm further weakness and drag it to 10.73 (200-DMA).