


 FxWirePro- Major Crypto levels and bias summary
  Ethereum Cracks Under $1,700: Sell the Rally Near $1,750 as Bears Eye $1,380–$1,200
  BTC’s Bear Bounce: Sell the Rally Near $66K as Bears Target $59K–$52K Breakdown


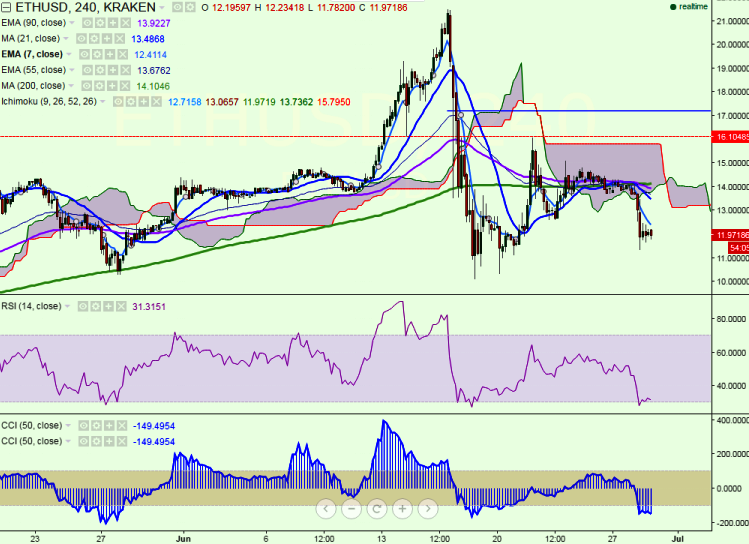
ETH/USD traded in the red on Wednesday and has broken a major support at $12.60 (Jun 23 low). It is currently trading at $11.91 levels (Kraken).
Ichimoku analysis (4-hour chart):
Tenkan-Sen level: $12.71
Kijun-Sen level: $13.06
Trend reversal level - (90 4H EMA)-$13.96
Long-term trend remains bullish for the pair and it faces major resistance at $12.55 (7 4H EMA) and any break above that level will take the pair till $13.06 (Hourly Kijun-Sen)/ $13.60 (21 4H MA). On the flipside, $11.33 (Jun 28 low) levels is likely to provide support to the pair and any violation below will drag the pair till $10.
“In 4-hour chart, ETH/USD is trading well below 21 4H MA .So dip till $10 is possible”, FxWirePro said in a statement.

- News

- Economy

- Central Banks
- Investing
- Research
- Roundups
- Digital Currency
- Insights
- Technical Analysis
- Technology
- Business
- Law
- Health
- Nature
- Fintech
- Science
- Topic
- Opinions
- ©Econometrics LLC . All Rights Reserved.
FxWirePro: ETH/USD trades weak, dip till $10.00 is likely
Wednesday, June 29, 2016 11:26 AM UTC
Editor's Picks


- Market Data
Most Popular


