


 FxWirePro- Major Crypto levels and bias summary
  Ethereum Cracks Below $2,000 as Bitcoin Contagion Bites—Bearish EMA Stack Sets Sights on $1,700
  Ethereum Tumbles Below $2K: Bears Eye $1,700 as All Key EMAs Flip Red
  FxWirePro- Major Crypto levels and bias summary
  FxWirePro- Major Crypto levels and bias summary
  Bitcoin Bleeds $704M in ETF Outflows as Institutional Exodus Accelerates
  Bitcoin Cracks $75K as $1.3B ETF Exodus and Middle East Jitters Spook Bulls; Bears Eye $70K


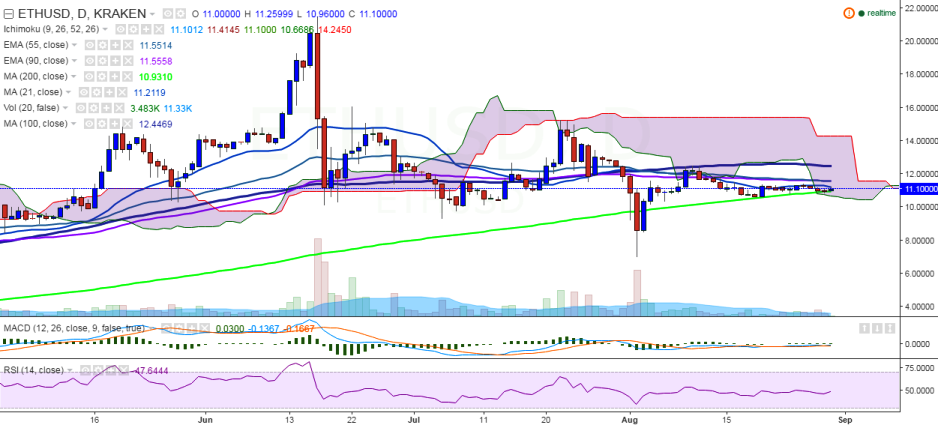
ETH/USD continues to trade in a narrow range on Tuesday and is trying to sustain above 200-day MA. It is currently trading at 11.02 levels, at the time of writing (Kraken).
Ichimoku analysis of daily chart:
Tenkan Sen: 11.10
Kijun Sen: 11.33
Trend reversal: 11.56 (90 EMA)
“ETH/USD is trading weak and closed below the 200-day MA trend line on Monday. A consistent break below this level would see the pair falling to August 02 low of 7.00 levels”, FxWirePro said in a statement.
On the upside, the pair will run into resistance at 11.56 (90 EMA) and a break above would see the pair reaching 12.47 (100-day MA)/ 13.64 (161.8% retracement of 12.49 and 10.65).
On the reverse side, 200-day MA is acting as a major support and further weakness will drag the pair to 9.10 (61.8% retracement of 7 and 12.49)/7.00 (August 2 low).

- News

- Economy

- Central Banks
- Investing
- Research
- Roundups
- Digital Currency
- Insights
- Technical Analysis
- Technology
- Business
- Law
- Health
- Nature
- Fintech
- Science
- Topic
- Opinions
- ©Econometrics LLC . All Rights Reserved.
FxWirePro: ETH/USD trades weak, good to sell on rallies
Tuesday, August 30, 2016 11:07 AM UTC
Editor's Picks


- Market Data
Most Popular


