


 FxWirePro- Major Crypto levels and bias summary
  Ethereum Cracks Under $1,700: Sell the Rally Near $1,750 as Bears Eye $1,380–$1,200
  FxWirePro- Major Crypto levels and bias summary
  FxWirePro- Major Crypto levels and bias summary


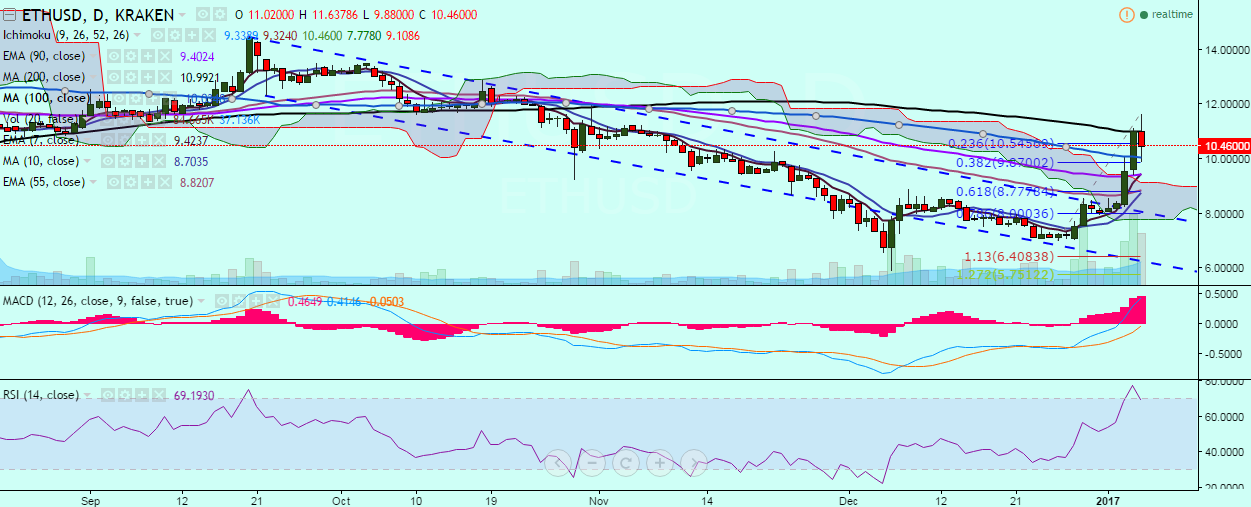
ETH/USD temporarily broke above the 200-DMA and hit a high of 11.63 levels. However, it failed to hold its strength and plunged to 10.46 levels where it currently trades (Kraken).
Ichimoku analysis (Daily chart):
Tenkan-Sen: 9.08
Kijun-Sen: 9.06
On the upside, a close above 11 (200-day MA) would face resistance at 11.63 (today’s high). Further strength would see the pair testing 12 (October 31 high).
Momentum studies remain bullish:
- RSI(14) is at 74
- MACD line is above signal line
On the flip side, the pair is likely to find support at 10.06 (100-DMA) and any violation would drag it to 9.37 (90 EMA)/9 (7 EMA).


