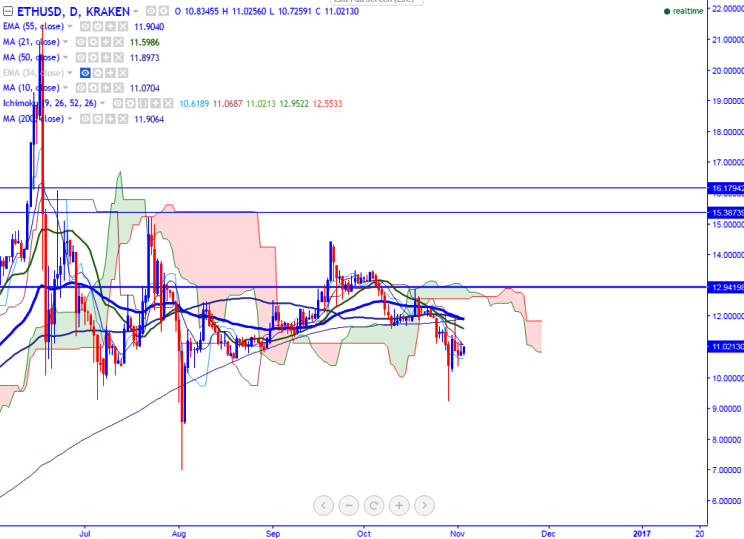
FxWirePro: ETH/USD upside capped by 10–day MA, good to sell on rallies
ETH/USD jumped till $11.19 yesterday and slightly declined from that level (KRAKEN). It is currently trading around $10.96 at the time of writing. Ichimoku analysis of daily chart shows: Tenkan-Sen $10.61 Kijun-Sen $11.0…
ETH/USD jumped till $11.19 yesterday and slightly declined from that level (KRAKEN). It is currently trading around $10.96 at the time of writing.
Ichimoku analysis of daily chart shows:
Tenkan-Sen $10.61
Kijun-Sen $11.06
Trend reversal - $11.95 (100 day MA)
Long-term trend remains to be neutral. In the daily chart, the pair is facing strong resistance at 10-day MA and a slight upside till $12 is possible only above that level.
Major resistance is around $11.16 (10- day MA) and any break above targets $11.64 (21- day MA)/$11.98 (55- day MA). Major support is seen at $10.61 (daily Tenkan-Sen) and any break below targets $10.29 (61.8% retracement of $9.23 and $12)/$9.23 (Oct 29th low).
EIP-8061 estimates higher exit and consolidation capacity in a 36 million ETH stake scenario. Its Nov. 1, 2026, date is a review deadline, not a network activation date.