


 FxWirePro- Major Crypto levels and bias summary
  BTC’s Bear Bounce: Sell the Rally Near $66K as Bears Target $59K–$52K Breakdown


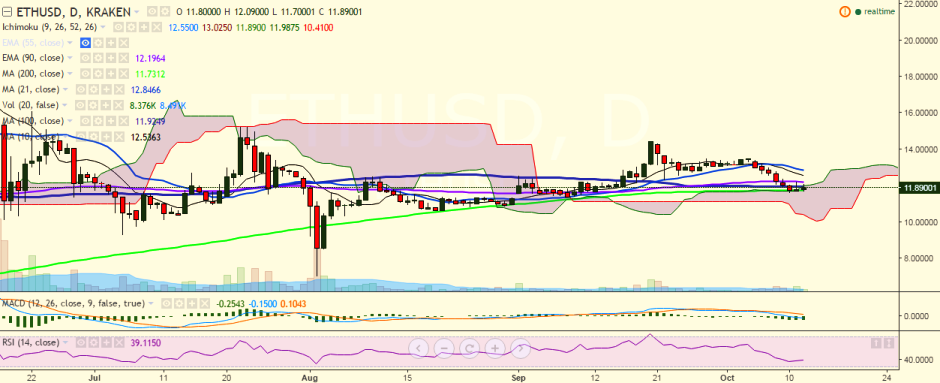
ETH/USD failed to break above 90 EMA, hit a high of 12.23 and closed below 12.00 mark on Tuesday. Today, the pair has hit 12.09 levels so far and is currently trading at 11.94 levels (Kraken).
Ichimoku analysis of daily chart:
Tenkan Sen: 12.55
Kijun Sen: 13.02
Trend reversal: 12.21 (90 EMA)
“The pair’s upside is capped by 23.6% retracement of 14.45 and 11.60. Short-term trend appears weak for the pair and so a dip till 11.35 is likely”, FxWirePro said in a statement.
The pair is currently hovering around 100-day MA and faces major resistance at 12.21 (90 EMA). A break above would target 12.66 (10-day MA)/12.93 (21-Day MA).
On the reverse side, support is likely to be found at October 10 low of 11.60 levels and a break below would drag it to 11.35 (September 08 low)/ 10.65 (August 19 low).

- News

- Economy

- Central Banks
- Investing
- Research
- Roundups
- Digital Currency
- Insights
- Technical Analysis
- Technology
- Business
- Law
- Health
- Nature
- Fintech
- Science
- Topic
- Opinions
- ©Econometrics LLC . All Rights Reserved.
FxWirePro: ETH/USD upside capped by 23.6% Fib, good to sell on rallies
Wednesday, October 12, 2016 11:06 AM UTC
Editor's Picks


- Market Data
Most Popular


