


 FxWirePro: AUD/USD falls after softer-than-expected Australian Q2 CPI
  FxWirePro: EUR/AUD regains upwards momentum but unable to hold above 50%fib level
  FxWirePro: USD/JPY eases ahead of Fed decision , Intervention risks linger
  FxWirePro: GBP/AUD gains some upside momentum but still bearish
  EUR/JPY Holds Bullish Bias as Euro Extends Recovery
  FxWirePro: GBP/NZD maintains bersish bias with focus on 2.2900 level
  EURUSD Spikes to 1.14306 on Fed Pause as Traders Eye Sell-the-Rally Setup
  FxWirePro: NZD/USD neutral in the near-term, scope for downward resumption
  Buy the Dips on EUR/JPY: Bullish Structure Points to 188 Target Ahead of Fed
  NZD/JPY Flatlines Near 94.60: Will Key Support Reignite the Uptrend?
  FxWirePro: USD/ZAR firms ahead of Fed interest rate decision
  FxWirePro- Woodies pivot (Major)
  FxWirePro- Woodies pivot (Major)
  FxWirePro: GBP/USD edges higher as traders await BoE guidance and UK fiscal clarity
  FxWirePro:EUR/NZD gains some upside momentum but still bearish
  FxWirePro: USD/CAD slips after Fed holds rates steady
  FxWirePro: USD/ CNY remains soft ahead of Fed decision


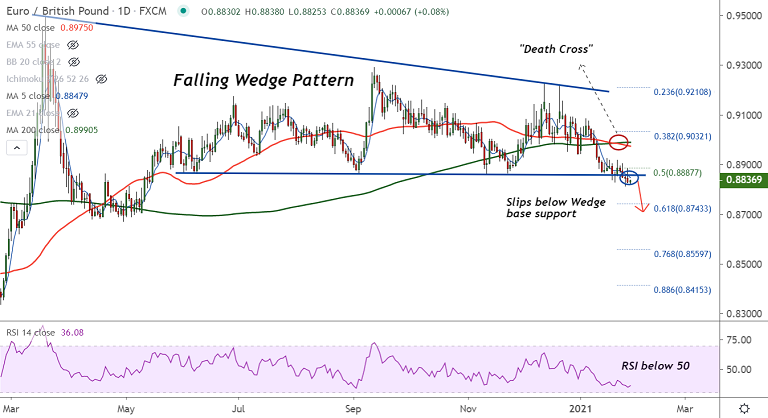
EUR/GBP chart - Trading View
Technical Analysis: Bias Bearish
- EUR/GBP holds support at 200W MA, break below required for downside continuation
- The pair is consolidating break below Wedge base support
- Momentum studies are bearish, Stochs and RSI support downside
- Price action is below major moving averages and volatility is rising as evidenced by widening Bollinger bands
- 'Death Cross' (bearish 50-DMA crossover on 200-DMA) on the daily charts keeps bias lower
Support levels - 0.8832 (200W MA), 0.8743 (61.8% Fib), 0.8670 (April 30 low)
Resistance levels - 0.8850 (5-DMA), 0.8887 (50% Fib), 0.8907 (21-EMA)
Summary: EUR/GBP has paused 4-day weakness and edged higher ahead of German GDP data. A big beat on expectations may put a bid under the single currency, pushing the pair higher. Technical bias is bearish. Break below 200W MA will plummet prices.


