


 AUDJPY Weakness Deepens: Sell Rallies Toward 112 as Aussie Dollar Falters
  FxWirePro: USD/JPY eases ahead of Fed decision , Intervention risks linger
  Crypto Action Bias: ETHUSD Stands Out as the Bullish Pair to Watch
  FxWirePro: GBP/NZD gains some ground but bias is still bearish
  FxWirePro: GBP/AUD gains some upside momentum but still bearish
  JPY Action Bias: USDJPY Emerges as the Clear Bullish Pair to Watch Amid Mixed Crosses
  FxWirePro: USD/ CNY remains soft ahead of Fed decision
  FxWirePro: EUR/ AUD gains some ground , but remains on bearish path
  FxWirePro: USD/ZAR retreats but trend is still bullish
  JPY Pairs Action Bias: EURJPY Leads as Bullish Standout Amid Mixed Momentum
  FxWirePro- Woodies pivot (Major)
  FxWirePro: NZD/USD neutral in the near-term, scope for downward resumption
  FxWirePro: USD/CAD runs out of steam but maintains bullish outlook
  Major Pairs Action Bias: USDCAD and USDCHF Stand Out as Extremely Bullish While GBPUSD and NZDUSD Turn Extremely Bearish
  FxWirePro: AUD/USD falls after softer-than-expected Australian Q2 CPI


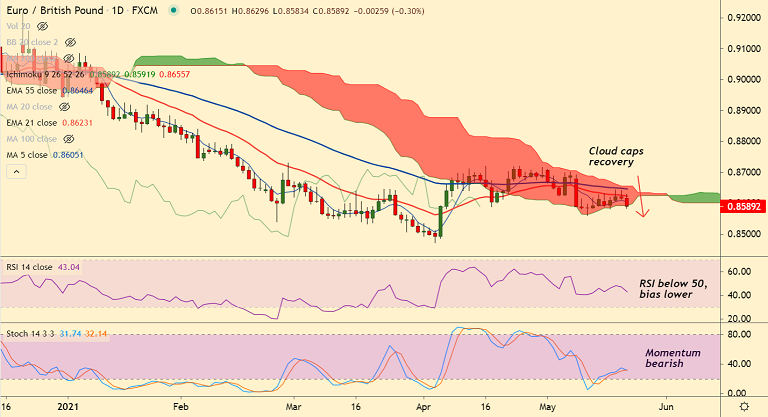
EUR/GBP chart - Trading View
Technical Analysis: Bias Bearish
- Recovery attempts capped at daily cloud
- Momentum indicators have turned bearish, RSI has slipped below 50
- The pair is extending weakness for the 4th straight week
- GMMA indicator shows major and minor trend are bearish on the daily and weekly charts
- Price action is below major MAs, MACD and ADX support downside in the pair
Support levels - 0.8560 (76.8% Fib), 0.8495 (Trendline), 0.8440 (Lower W BB)
Resistance levels - 0.8606 (200H MA), 0.8637 (20-DMA), 0.8646 (55-EMA)
Summary: Upbeat UK Retail Sales and mixed UK PMI prints provide some support to the British pound. Pullback from multi-week lows has been capped at daily cloud. Technical indicators are turning bearish and the pair is on track to test 76.8% Fib at 0.8560 ahead of trendline support at 0.8495. Bearish invalidation only above daily cloud.


