


 FxWirePro: GBP/NZD down trend loses steam, remains on bearish path
  FxWirePro: USD/CAD extends decline on broad dollar weakness
  FxWirePro- Major European Indices
  FxWirePro: EUR/AUD downtrend loses steam but outlook still bearish
  Euro Holds the Line: EURUSD Finds Support at the 365-EMA as Peace Talks Loom
  FxWirePro:NZD/USD uptrend loses momentum but bullish setup remains
  FxWirePro- Major Crypto levels and bias summary
  FxWirePro: GBP/AUD gains some upside momentum but still bearish
  FxWirePro: AUD/USD retreats slightly but trend is still bullish
  FxWirePro: USD/JPY holding bid into weekend
  FxWirePro: GBP/USD biased higher but rally currently stretched
  FxWirePro: GBP/USD bulls remain cautiously optimistic
  FxWirePro- Woodies Pivot(Major)
  NZDJPY Bulls Charge Toward 95.00: Safe-Haven Exodus Drives Kiwi Rally
  Energy Surge Ignites US Inflation: USDCHF Eyes Support Amid Dollar Sell-Off
  FxWirePro: EUR/AUD under pressure as key support gives way
  FxWirePro- Major Pair levels and bias summary


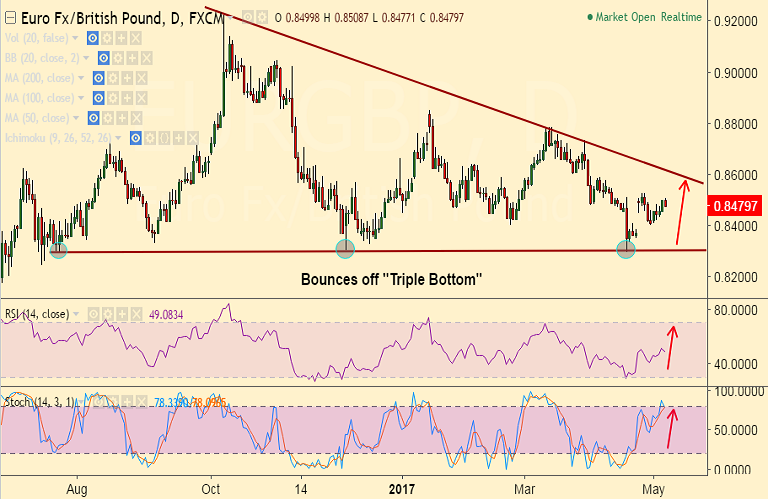
- Weekly 50-SMA at 0.8502 is strong resistance and EUR/GBP has failed to close above for past 2 weeks.
- Stochs and RSI on the weekly charts are slightly bullishly aligned. Stochs are on the verge of a rollover from oversold levels and RSI has turned north.
- On the daily charts the pair has closed above 20-DMA and we have seen a 5&20 DMA bullish crossover.
- The pair finds strong support by triple bottom at 0.83 levels and we see major weakness only on break below.
- We see scope for test of 100-DMA at 0.8551. Violation there could see gains upto 0.8593 (200-DMA and then 0.86 (trendline).
Support levels - 0.8469 (5-DMA), 0.8455 (20-DMA), 0.84 (April 28 low)
Resistance levels - 0.85 (weekly 50-SMA), 0.8530 (April 25/26 high), 0.8551 (50-DMA), 0.8593 (200-DMA)
TIME TREND INDEX OB/OS INDEX
1H Bearish Neutral
4H Neutral Neutral
1D Bullish Neutral
1W Neutral Neutral
Recommendation: Good to go long on break above 0.85, SL: 0.8450, TP: 0.8550/ 0.86
FxWirePro Currency Strength Index: FxWirePro's Hourly EUR Spot Index was at 115.808(Bullish), while Hourly GBP Spot Index was at -10.1911 (Neutral) at 0830 GMT. For more details on FxWirePro's Currency Strength Index, visit http://www.fxwirepro.com/currencyindex.


