
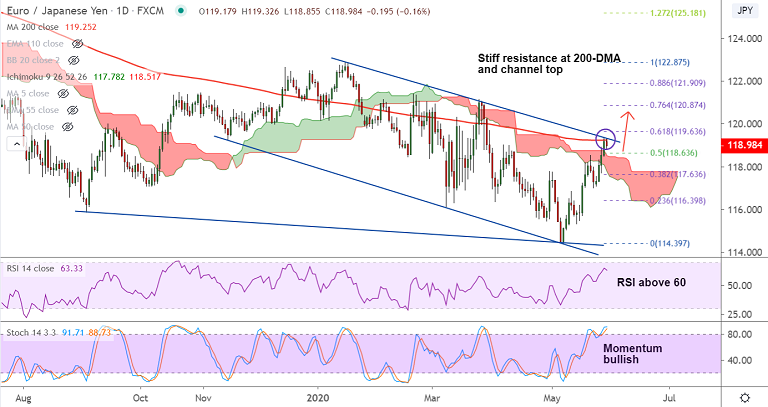
EUR/JPY chart - Trading View
Technical Analysis: Bias Bullish
GMMA Indicator
- Major trend is turning bullish, while minor trend is strongly bullish
- GMMA keeps scope for further gains
Ichimoku Analysis
- Price action has shown a break above daily cloud
- Bullish Tenkan Sen crossover on Kijun Sen supports upside bias
- Chikou Span has turned south which suggests minor pullback
- Pullbacks are likely to hold support at Tenkan Sen, violation below will negate upside bias
Oscillators
- Oscillators are bullishly aligned
- RSI is above 60 and Stochastics show bullish momentum
Bollinger Bands
- Bollinger bands are widening on the daily charts
- Rising volatility with bullish momentum could carry the pair higher
Major Support Levels: 118.41 (converged 5-DMA and 110-EMA), 117.62 (55-EMA), 117.42 (21-EMA)
Major Resistance Levels: 119.25 (converged 200-DMA and channel top), 119.63 (61.8% Fib), 120.22 (55W EMA)
Summary: The pair has paused upside at major resistance at 200-DMA and channel top. Technical bias remains bullish. Breakout at 200-DMA will propel the pair higher. Strong support is seen at 118.41 (converged 5-DMA and 110-EMA). Major weakness only below 55-EMA.


