


 FxWirePro : USD/JPY holds relatively bid on 163 ahead Of FOMC,BoJ meetings
  NZDJPY Action Bias: Bullish Dip-Buying Opportunity on Broad Yen Weakness
  FxWirePro- Woodies pivot (Major)
  AUDJPY Weakness Deepens: Sell Rallies Toward 112 as Aussie Dollar Falters
  JPY Action Bias: Bullish Pairs to Watch Out For
  FxWirePro: USD/CAD gaining momentum for a move towards 1.4200 level
  FxWirePro: NZD/USD gains as U.S.-Iran peace hopes boost risk sentiment
  FxWirePro: GBP/NZD gains some ground but bias is still bearish
  Major Pairs Action Bias: USDCAD and USDCHF Stand Out as Extremely Bullish While GBPUSD and NZDUSD Turn Extremely Bearish
  FxWirePro: USD/ZAR uptrend loses steam, remains on bullish path
  FxWirePro- Major Pair levels and bias summary
  AUDJPY Action Bias: Bullish Dip-Buy Setup Despite Flat Neutral Bias
  GBPJPY Slips After Sterling Weakness, Bears Eye 216
  FxWirePro: GBP/NZD downside pressure builds, key support levels in focus
  FxWirePro: USD/CNY dips as yuan firms on improving risk appetite
  FxWirePro: EUR/NZD up trend gains momentum but hurdles ahead
  Major Pair Action Bias: Bullish Pairs to Watch Out For


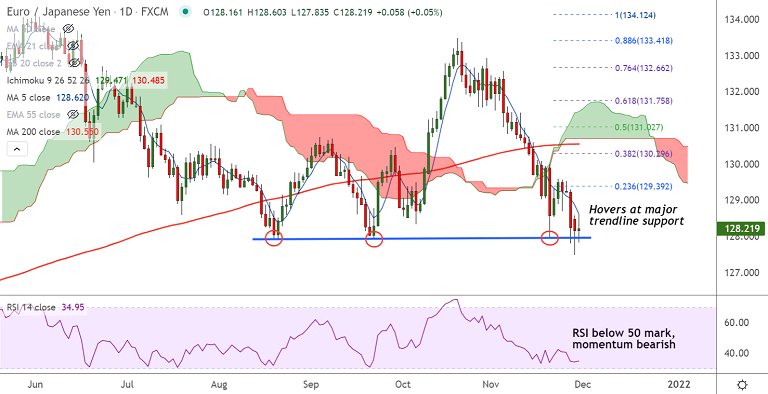
Chart - Courtesy Trading View
Technical Analysis: Bias Bearish
GMMA Indicator
- Shows strong bearish bias on near and long term moving averages on daily and intraday charts
Ichimoku Analysis
- Price action well below the daily cloud, Chikou span is biased lower
- The pair is extending break into the weekly cloud
Oscillators
- Stochs and RSI show strong bearish momentum
- RSI is well below the 50 mark and shows strength in the current downtrend
Bollinger Bands
- Bollinger bands are spread wide apart and are showing signs of further widening
- Volatility is hence high and rising, likely to add fuel to the downside momentum
Major Support Levels: 127.93 (trendline support), 127.15 (110-week EMA)
Major Resistance Levels: 128.63 (5-DMA), 128.84 (55-week EMA)
Summary: EUR/JPY has paused downside at major trendline support at 127.93. Decisive break below is required for downside continuation.


