


 FxWirePro:EUR/NZD gains some upside momentum but still bearish
  FxWirePro: NZD/USD firms as Kiwi gains on strong ANZ business outlook data
  Major European Indices Score Extremely Bullish: DAX Eyes 26000, CAC Targets 8600, FTSE100 at 11000 – Key Levels to Watch
  Global Markets React to Strong U.S. Jobs Data and Rising Yields
  Gold Prices Fall Amid Rate Jitters; Copper Steady as China Stimulus Eyed
  Indonesia Surprises Markets with Interest Rate Cut Amid Currency Pressure
  FxWirePro: USD/CAD slips after Fed holds rates steady
  AUDJPY Volatile After Massive Sell-Off: Sell Rallies at 113, Targeting 110 as Bearish Momentum Surges
  NZDJPY Retreats on Yen Strength – Bearish Setup Targets 90 After Hitting 92.75 Low
  UBS Projects Mixed Market Outlook for 2025 Amid Trump Policy Uncertainty
  Lithium Market Poised for Recovery Amid Supply Cuts and Rising Demand
  FxWirePro: AUD/USD gains some ground but outlook is bearish
  European Stocks Rally on Chinese Growth and Mining Merger Speculation
  China’s Growth Faces Structural Challenges Amid Doubts Over Data
  FxWirePro: EUR/AUD regains upwards momentum but unable to hold above 50%fib level
  FxWirePro: GBP/NZD remains weak, eyes 38.2%fib support
  Nikkei Surges Past 65,000 on Suspected Yen Weakness: Tech Giants Like Advantest and NEC Lead Explosive Gains


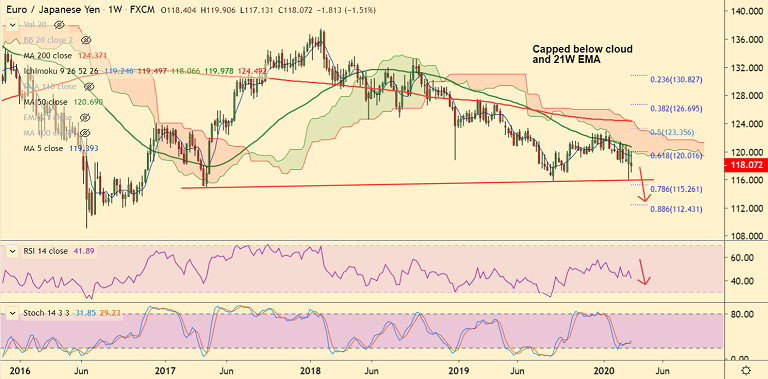
EUR/JPY chart - Trading View
EUR/JPY has failed to sustain Friday's massive gains. Upside has been capped at 200-DMA which is stiff resistance (currently at 120.10).
After a few extremely volatile sessions, the pair is currently trading 0.30% lower on the day at 118.03 at around 10:40 GMT.
Back-to-back long-legged Dojis on the daily charts suggests selling pressure and highs.
Major and minor trend for the pair are bearish as evidenced by the downward sloping moving averages in the GMMA indicator.
Price action is capped below weekly cloud and 21W EMA (currently at 120.057). Momentum is bearish and RSI is below 50.
Resumption of downside likely. Next bear target lies at 116 (trendline) ahead of 78.6% Fib at 115.26.
Support levels - 116 (trendline), 115.26 (78.6% Fib)
Resistance levels - 119.02 (21-EMA), 120.10 (200-DMA)
Recommendation: Good to stay short on upticks around 118.20-118.60, SL: 120.00, TP: 117.70/ 117/ 116.


