


 FxWirePro: USD/ZAR firms ahead of Fed interest rate decision
  FxWirePro- Woodies pivot (Major)
  FxWirePro: USD/JPY eases ahead of Fed decision , Intervention risks linger
  FxWirePro: USD/CAD runs out of steam but maintains bullish outlook
  FxWirePro: NZD/USD neutral in the near-term, scope for downward resumption
  FxWirePro: GBP/AUD gains above 1.9200 level , upside pressure builds
  FxWirePro : GBP/NZD strongly bearish despite upside attempts
  FxWirePro: AUD/USD falls after softer-than-expected Australian Q2 CPI
  Major Forex Pairs Action Bias: GBPUSD and AUDUSD Turn Extremely Bearish
  FxWirePro: EUR/ AUD gains some ground , but remains on bearish path
  JPY Action Bias: EURJPY and CADJPY Emerge as Extremely Bullish Pairs to Watch
  FxWirePro: NZD/USD firms as Kiwi gains on strong ANZ business outlook data
  FxWirePro- Major Crypto levels and bias summary
  Buy the Dips on EUR/JPY: Bullish Structure Points to 188 Target Ahead of Fed
  NZDJPY Bullish Rebound: Buy Dips as EMAs Align for 97 Target
  JPY Pairs Action Bias: EURJPY Leads as Bullish Standout Amid Mixed Momentum
  EURUSD Spikes to 1.14306 on Fed Pause as Traders Eye Sell-the-Rally Setup


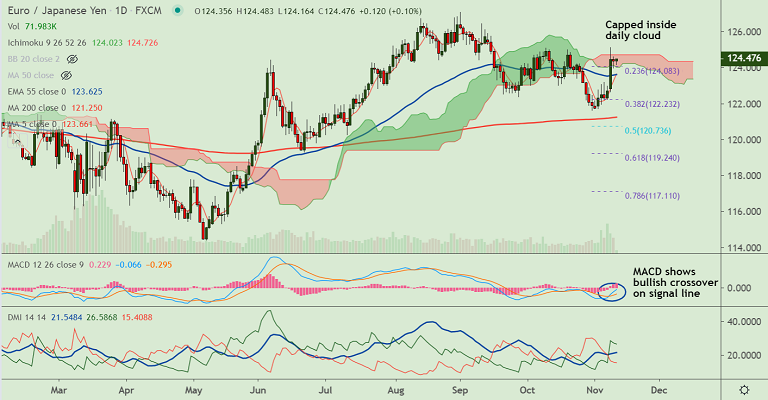
EUR/JPY chart - Trading View
Technical Analysis: Bias Bullish
- EUR/JPY was extending range trade for the second straight session
- Price action remains capped within the daily cloud and break above will provide upside boost
- MACD and ADX support upside in the pair and volatility is rising as evidenced by widening Bollinger bands
- Oscillators are biased higher, price action is above major moving averages, RSI on the daily and weekly charts is above 50 mark
Support levels - 123.62 (nearly converged 5-DMA and 55-EMA), 123.22 (38.2% Fib), 123.09 (110-EMA)
Resistance levels - 125.18 (200W MA), 125.95 (50% Fib), 126.30 (Trendline)
Summary: EUR/JPY trades with a bullish bias. The pair finds stiff resistance at 200W MA at 125.18. Breakout above cloud and 200W MA will propel the pair higher. Failure to break above cloud and retrace below 55-EMA will negate any bullish bias.


