


 FxWirePro : USD/JPY holds relatively bid on 163 ahead Of FOMC,BoJ meetings
  AUDJPY Weakness Deepens: Sell Rallies Toward 112 as Aussie Dollar Falters
  FxWirePro- Major Pair levels and bias summary
  FxWirePro: EUR/NZD up trend gains momentum but hurdles ahead
  Major Pairs Action Bias: USDCAD and USDCHF Stand Out as Extremely Bullish While GBPUSD and NZDUSD Turn Extremely Bearish
  FxWirePro- Major Crypto levels and bias summary
  FxWirePro: USD/CAD runs out of steam but maintains bullish outlook
  FxWirePro- Major Pair levels and bias summary
  GBPJPY Slips After Sterling Weakness, Bears Eye 216
  FxWirePro: GBP/AUD downside pressure builds, key support level in focus
  Crypto Action Bias: ETHUSD Stands Out as the Bullish Pair to Watch
  AUDJPY Action Bias: Bullish Dip-Buy Setup Despite Flat Neutral Bias
  FxWirePro: AUD/USD dips after RBA Governor speech
  FxWirePro: NZD/USD edges lower, remains on back foot
  JPY Action Bias: USDJPY Emerges as the Clear Bullish Pair to Watch Amid Mixed Crosses
  NZDJPY Action Bias: Bullish Dip-Buying Opportunity on Broad Yen Weakness


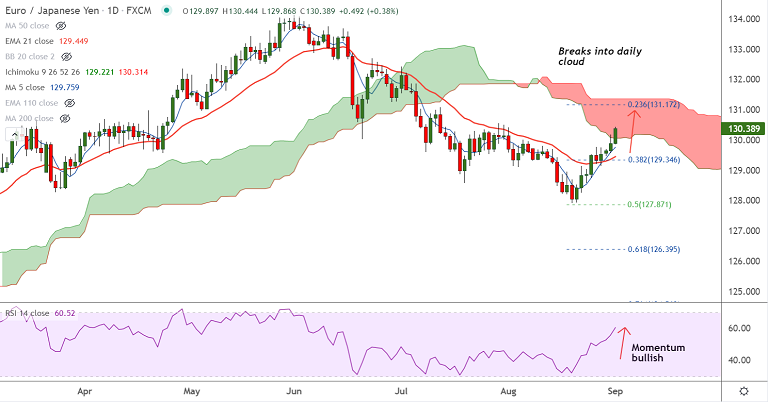
EUR/JPY chart - Trading View
Technical Analysis: Bias Bearish
- Price action has re-entered into the daily cloud
- Momentum is strongly bullish, Stochs and RSI are sharply higher
- Volatility is high and rising as evidenced by widening Bollinger bands
- GMMA indicator shows near-term trend has turned bullish
Data Watch:
According to the latest data reported by Germany’s Destatis on Monday, the country’s Retail Sales dropped by 5.1% MoM in July versus -0.9% expected and 4.2% last.
On an annualized basis, the German Retail Sales came in at -0.3% in July versus 3.7% expected and 6.2% reported in June.
Both German and EMU final Manufacturing PMIs came in a tad below the preliminary readings at 62.6 and 61.4, respectively, for the month of August.
The Unemployment Rate in the broader Euroland ticked lower to 7.6% in July.
Support levels - 130.00 (converged 110 and 55 EMAs), 129.76 (5-DMA), 129.45 (21-EMA)
Resistance levels - 130.42 (Upper BB), 131.09 (20-week EMA), 131.17 (23.6% Fib)
Summary: EUR/JPY unfazed by mixed euro area data. The pair is extending gains for the 4th straight session.
The single currency garnered extra support from hawkish comments from ECB’s Knot and Holzmann on Tuesday, who advocated for a slower pace of bond purchases.
Break into daily cloud has reinforced bullish bias. Scope for test of 131 levels. Bullish invalidation likely on retrace below 21-EMA.


