


 FxWirePro:USD/JPY climbs back above 160.00 after BOJ rate decision
  FxWirePro: AUD/USD gains some ground but outlook is bearish
  FxWirePro: GBP/NZD remains weak, eyes 38.2%fib support
  FxWirePro- Woodies pivot (Major)
  NZDJPY Retreats on Yen Strength – Bearish Setup Targets 90 After Hitting 92.75 Low
  FxWirePro: GBP/NZD remains weak, eyes 38.2%fib support
  FxWirePro: NZD/USD consolidates overnight gains, but loses momentum
  FxWirePro: USD/CAD retreats after Canada posts stronger-than-expected GDP growth
  FxWirePro: GBP/AUD drifts lower after BOE rate decision
  NZDJPY Bullish Rebound: Buy Dips as EMAs Align for 97 Target
  JPY Currency Meter Signals: NZDJPY Bullish (+25) vs CHFJPY (-100) – These Pairs Could Move Next
  FxWirePro: GBP/USD rises as soft US data pressures dollar
  FxWirePro- Major Crypto levels and bias summary
  FxWirePro: GBP/AUD bears maintain upper hand
  Major FX Action Bias & US Market Sentiment: NZD/USD (Extremely Bullish) & AUD/USD (Bullish) Watchlist
  AUD/JPY Slips Below 112 as BOJ Intervention Sparks Bearish Momentum: Sell the Rallies


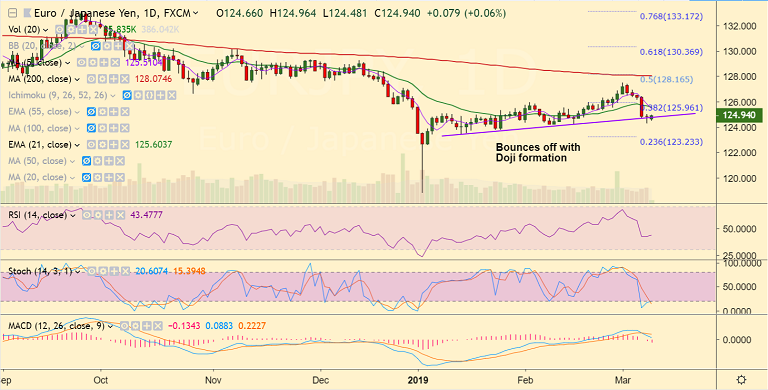
EUR/JPY chart - Trading View
- EUR/JPY is extending recovery from 3-week lows at 124.27 hit on Thursday's trade.
- The pair bounced off with a 'Dragonfly Doji' formation on Friday's trade, raising scope for further upside.
- Price action is trading short of 125 handle and break above will see further gains.
- Technical studies are largely bearish. We see a bearish engulfing candle on the weekly charts.
- Upside recovery attempts likely to be limited. We see stiff resistance in the 125.65 to 125.80 zone.
- Traders now await German Industrial Output and Trade Balance data for further impetus.
Support levels - 124.17 (Lower BB), 124, 123.40 (Jan 15 low)
Resistance levels - 125.51 (5-DMA), 125.80 (55-EMA), 126
For details on FxWirePro's Currency Strength Index, visit http://www.fxwirepro.com/currencyindex.


