


 FxWirePro: USD/ZAR retreats but trend is still bullish
  FxWirePro: EUR/NZD up trend gains momentum but hurdles ahead
  FxWirePro: NZD/USD edges lower, remains on back foot
  EUR/JPY Holds Bullish Bias as Euro Extends Recovery
  FxWirePro: EUR/AUD outlook weaker on renewed downside pressure
  FxWirePro: USD/CAD runs out of steam but maintains bullish outlook
  FxWirePro: GBP/AUD gains some upside momentum but still bearish
  EUR/USD Bounces from Monthly Low, But Bearish Pressure Remains
  NZD/JPY Flatlines Near 94.60: Will Key Support Reignite the Uptrend?
  FxWirePro: GBP/NZD maintains bersish bias with focus on 2.2900 level
  Crypto Action Bias: ETHUSD Stands Out as the Bullish Pair to Watch
  FxWirePro : USD/JPY holds relatively bid on 163 ahead Of FOMC,BoJ meetings
  FxWirePro: GBP/USD edges higher as traders await BoE guidance and UK fiscal clarity
  FxWirePro: NZD/USD neutral in the near-term, scope for downward resumption
  FxWirePro: AUD/USD dips after RBA Governor speech
  AUDJPY Weakness Deepens: Sell Rallies Toward 112 as Aussie Dollar Falters


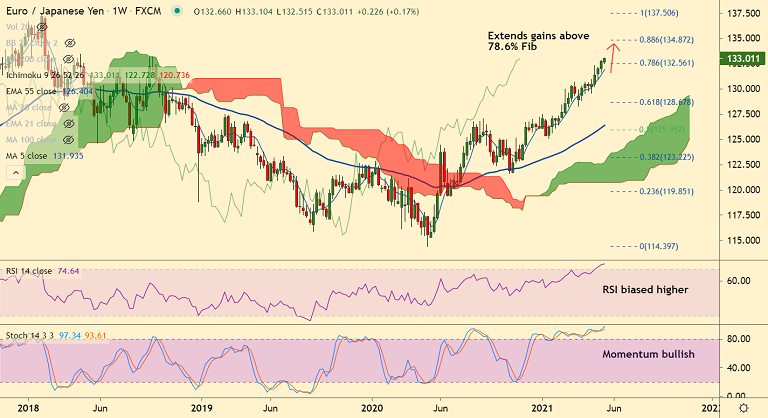
EUR/JPY chart - Trading View
Spot Analysis:
EUR/JPY was trading 0.32% higher on the day at 133.07 at around 10:25 GMT
Previous Week's High/Low: 132.95/ 132.51
Previous Session's High/Low: 132.84/ 131.64
Fundamental Overview:
Eurozone GDP contracts by 0.6% QoQ in Q1, matching -0.6% expected, the second estimate confirmed earlier on Tuesday.
On an annualized basis, the bloc’s GDP dropped by 1.8% in Q1 vs. -1.8% seen in the first reading while meeting -1.8% expectations.
Separately, Eurozone's employment fell by 0.3% and 2.1% on QOQ and YoY respectively in Q1 2021.
Meanwhile, the Union’s trade balance arrived at EUR13.0B in March vs. EUR23.1B last.
Technical Analysis:
- GMMA indicator shows major and minor trend are strongly bullish on daily and weekly charts
- Price action is above daily cloud and major moving averages
- Momentum studies support upside, Stochs and RSI are strongly bullish
- MACD and ADX also support gains
- Breakout above 200-month MA has opened upside
Major Support and Resistance Levels:
Support - 132.56 (78.6% Fib), 131.68 (21-EMA), 130.29 (200-month MA)
Resistance - 133.32 (Upper BB), 133.48 (Apr 2018 high), 134.87 (88.6% Fib)
Summary: EUR/JPY trades with a bullish bias. Scope for test of 88.6% Fib at 134.87. Bullish invalidation only on retrace below 200-month MA.


