


 FxWirePro: EUR/ AUD gains some ground , but remains on bearish path
  FxWirePro: AUD/USD falls after softer-than-expected Australian Q2 CPI
  FxWirePro- Major Crypto levels and bias summary
  FxWirePro: GBP/AUD gains some upside momentum but still bearish
  Buy the Dips on EUR/JPY: Bullish Structure Points to 188 Target Ahead of Fed
  EURUSD Spikes to 1.14306 on Fed Pause as Traders Eye Sell-the-Rally Setup
  FxWirePro: USD/ZAR retreats but trend is still bullish
  Major Forex Pairs Action Bias: GBPUSD and AUDUSD Turn Extremely Bearish
  Crypto Action Bias: ETHUSD Stands Out as the Bullish Pair to Watch
  NZD/JPY Flatlines Near 94.60: Will Key Support Reignite the Uptrend?
  FxWirePro: USD/ZAR firms ahead of Fed interest rate decision
  FxWirePro: GBP/USD edges higher as traders await BoE guidance and UK fiscal clarity
  FxWirePro- Woodies pivot (Major)
  FxWirePro: USD/CAD runs out of steam but maintains bullish outlook
  FxWirePro: USD/CAD slips after Fed holds rates steady


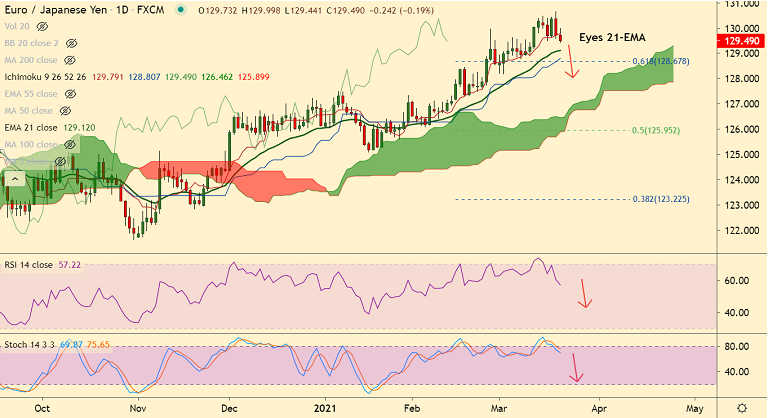
EUR/JPY chart - Trading View
Technical Analysis: Bias Bearish
- EUR/JPY pared early gains and slipped lower on the day
- The pair failed to capitalize on the bullish gap open, failed to extend gains above 5-DMA
- Stochs and RSI are on verge of bearish rollover from overbought levels
- Price action has slipped below 200H MA, GMMA indicator shows bearish shift on intraday charts
- The pair seems to find stiff resistance at 200-month MA at 130.31, decisive break above required for upside continuation.
Support levels - 129.12 (21-EMA), 129.02 (5W MA), 127.86 (55-EMA)
Resistance levels - 129.86 (200H MA), 130.31 (200 month MA), 130.60 (Upper BB)
Summary: EUR/JPY capped at 200-month MA, break below 200H MA raises scope for further weakness. Market sentiment stays mixed as vaccine, unlock optimism battles reflation, geopolitical fears. The pair eyes 21-EMA support at 129.12, break below to see more weakness.


