


 FxWirePro: NZD/USD consolidates overnight gains, but loses momentum
  China’s Growth Faces Structural Challenges Amid Doubts Over Data
  Goldman Predicts 50% Odds of 10% U.S. Tariff on Copper by Q1 Close
  European Stocks Rally on Chinese Growth and Mining Merger Speculation
  Moody's Upgrades Argentina's Credit Rating Amid Economic Reforms
  FxWirePro- Major Pair levels and bias summary
  FxWirePro: GBP/AUD drifts lower after BOE rate decision
  Global Markets React to Strong U.S. Jobs Data and Rising Yields
  FxWirePro: GBP/USD rises as soft US data pressures dollar
  NZDJPY Retreats on Yen Strength – Bearish Setup Targets 90 After Hitting 92.75 Low
  FxWirePro: USD/JPY edges higher as focus shifts to BOJ decision
  FxWirePro- Woodies pivot (Major)
  JPY Action Bias: EURJPY and CADJPY Emerge as Extremely Bullish Pairs to Watch
  NZDJPY Bullish Rebound: Buy Dips as EMAs Align for 97 Target
  Mexico's Undervalued Equity Market Offers Long-Term Investment Potential
  FxWirePro: USD/ CNY hits one-month low,scope for futher downside
  Gold Prices Slide as Rate Cut Prospects Diminish; Copper Gains on China Stimulus Hopes


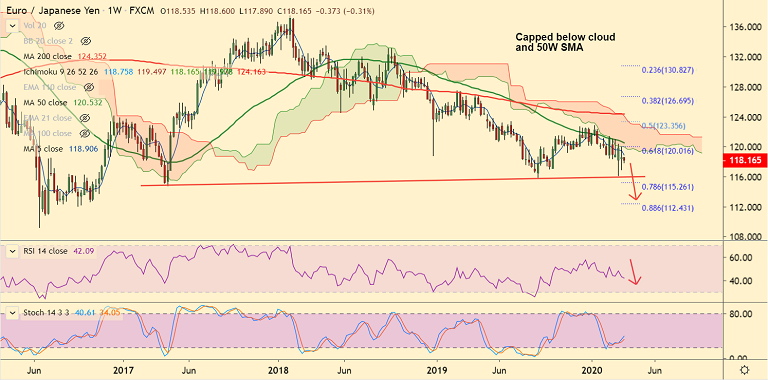
EUR/JPY chart - Trading View
EUR/JPY was trading 0.36% lower on the day at 118.16 at around 05:40 GMT, after closing 0.17% higher in the previous session.
Fears of a coronavirus-led slowdown in the global economy were bolstered after the US Senate's failure to push forward the rescue package.
The pair has failed to break past 21W EMA and weekly cloud and 5W SMA has turned sharply lower.
GMMA indicator shows major and minor trend on the weekly charts is strongly bearish.
Indicators on the daily charts have turned neutral, but the pair has completed a 'Death Cross' on the daily charts which could plummet prices.
Lower Bollinger band at 116.86 is immediate support ahead of major trendline support at 116. Break below eyes 78.6% Fib at 115.26.
On the flipside 21-EMA is immediate resistance at 118.84. Break above 50W SMA (120.53) could support near-term upside.
Support levels - 116.86 (Lower BB), 116 (Trendline)
Resistance levels - 118.84 (21-EMA), 120.53 (50W SMA)


