


 Major Pairs Action Bias: USDCAD and USDCHF Stand Out as Extremely Bullish While GBPUSD and NZDUSD Turn Extremely Bearish
  FxWirePro: GBP/NZD maintains bersish bias with focus on 2.2900 level
  FxWirePro- Woodies pivot (Major)
  JPY Action Bias: USDJPY Emerges as the Clear Bullish Pair to Watch Amid Mixed Crosses
  FxWirePro: USD/JPY eases ahead of Fed decision , Intervention risks linger
  NZDJPY Pullback: Sell Rallies Toward 93.30 as Yen Weakness Eases
  FxWirePro: EUR/NZD up trend gains momentum but hurdles ahead
  FxWirePro: USD/ZAR retreats but trend is still bullish
  EUR/JPY Holds Bullish Bias as Euro Extends Recovery
  NZD/JPY Flatlines Near 94.60: Will Key Support Reignite the Uptrend?
  FxWirePro: NZD/USD edges lower, remains on back foot
  FxWirePro: AUD/USD dips after RBA Governor speech
  EUR/USD Bounces from Monthly Low, But Bearish Pressure Remains
  FxWirePro- Major Pair levels and bias summary
  FxWirePro : USD/JPY holds relatively bid on 163 ahead Of FOMC,BoJ meetings


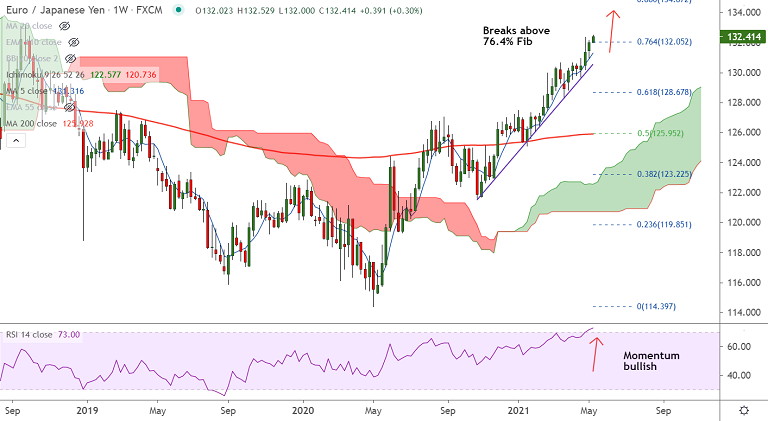
EUR/JPY chart - Trading View
EUR/JPY was trading 0.22% higher on the day at 132.31, slightly lower from session highs at 132.38.
The pair has started the week on a bullish note and price action has tested new 2 1/2 year highs.
Technical analysis supports upside in the pair. Momentum is bullish and volatility is high and rising.
GMMA indicator shows major and minor trend in the pair are strongly bullish. MACD and ADX also support upside in the pair.
Price action has broken above 76.4% Fib retracement at 132.05 and is extending break above 200-month MA.
Little resistance is seen for bulls till 88.6% Fib at 134.87. On the flipside, 5-DMA is immediate support at 131.66. Bullish invalidation likely below 200-month MA.


