


 NZDJPY Retreats on Yen Strength – Bearish Setup Targets 90 After Hitting 92.75 Low
  AUDJPY Volatile After Massive Sell-Off: Sell Rallies at 113, Targeting 110 as Bearish Momentum Surges
  FxWirePro: GBP/NZD remains weak, eyes 38.2%fib support
  Major European Indices Score Extremely Bullish: DAX Eyes 26000, CAC Targets 8600, FTSE100 at 11000 – Key Levels to Watch
  FxWirePro:USD/JPY climbs back above 160.00 after BOJ rate decision
  FxWirePro- Major Crypto levels and bias summary
  FxWirePro: GBP/AUD drifts lower after BOE rate decision
  FxWirePro: USD/CNY dips to hit three year low,scope for further downside
  FxWirePro- Major Crypto levels and bias summary
  Nikkei Surges Past 65,000 on Suspected Yen Weakness: Tech Giants Like Advantest and NEC Lead Explosive Gains
  FxWirePro: NZD/USD consolidates overnight gains, but loses momentum
  US Magnificent 7 Stocks Trend Score: Amazon & Microsoft Hit Extreme Bullish (+100) as Meta Drops to -100 — Key Resistance & Support Watchlist
  FxWirePro- Woodies pivot (Major)
  FxWirePro: EUR/ AUD dips below 1.6400 level, focus on near term support
  AUD/JPY Slips Below 112 as BOJ Intervention Sparks Bearish Momentum: Sell the Rallies


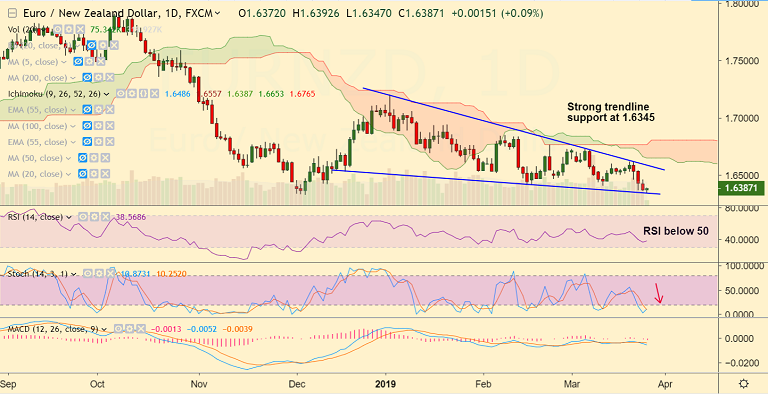
EUR/NZD chart - Trading View
Daily Chart Pattern: Descending Triangle
EUR/NZD Technical Analysis:
- Has paused downside at 200W SMA, break below to see further weakness
- Next major support lies at 1.6345 (Triangle Base)
- RSI is below 50, bias lower, Stochs show bearish momentum
- Bollinger Bands are widening in support of rising volatility
- Price action below cloud and major moving averages
Support levels - 1.6360 (200W SMA), 1.6345 (Triangle base), 1.6329 (Dec 5 low), 1.6139 (Sept 2017 low)
Resistance levels - 1.6463 (5-DMA) 1.6527 (21-EMA), 1.6628 (55-EMA)
Recommendation: Good to stay short below 200W SMA, SL: 1.6470, TP: 1.6330/ 1.62/ 1.6140
For details on FxWirePro's Currency Strength Index, visit http://www.fxwirepro.com/currencyindex.

- News

- Economy

- Central Banks
- Investing
- Research
- Roundups
- Digital Currency
- Insights
- Technical Analysis
- Technology
- Business
- Law
- Health
- Nature
- Fintech
- Science
- Topic
- Opinions
- ©Econometrics LLC . All Rights Reserved.
FxWirePro: EUR/NZD Near-Term Outlook
Tuesday, March 26, 2019 6:59 AM UTC
Editor's Picks


- Market Data
Most Popular


