


 NZDJPY Retreats on Yen Strength – Bearish Setup Targets 90 After Hitting 92.75 Low
  Major European Indices Score Extremely Bullish: DAX Eyes 26000, CAC Targets 8600, FTSE100 at 11000 – Key Levels to Watch
  NZDJPY Bullish Rebound: Buy Dips as EMAs Align for 97 Target
  FxWirePro: AUD/USD gains some ground but outlook is bearish
  JPY Currency Meter Signals: NZDJPY Bullish (+25) vs CHFJPY (-100) – These Pairs Could Move Next
  FxWirePro: GBP/NZD remains weak, eyes 38.2%fib support
  FxWirePro: GBP/AUD bears maintain upper hand
  FxWirePro:USD/JPY climbs back above 160.00 after BOJ rate decision
  FxWirePro: GBP/NZD remains weak, eyes 38.2%fib support
  US Magnificent 7 Stocks Trend Score: Amazon & Microsoft Hit Extreme Bullish (+100) as Meta Drops to -100 — Key Resistance & Support Watchlist
  FxWirePro: USD/CNY dips to hit three year low,scope for further downside
  FxWirePro- Major Crypto levels and bias summary
  AUD/JPY Slips Below 112 as BOJ Intervention Sparks Bearish Momentum: Sell the Rallies
  FxWirePro: USD/CAD retreats after Canada posts stronger-than-expected GDP growth
  FxWirePro: GBP/USD rises as soft US data pressures dollar
  FxWirePro: GBP/AUD drifts lower after BOE rate decision


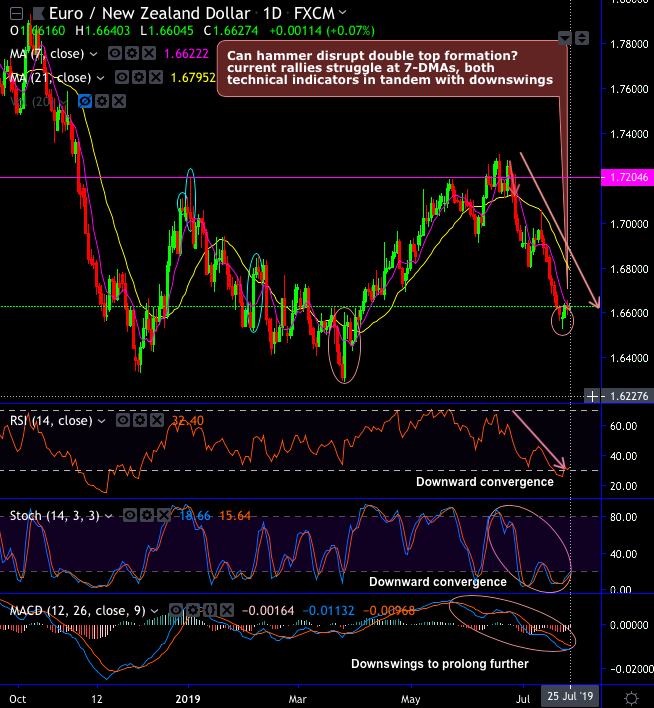
The minor trend of EURNZD has been jittery especially after the formation of hanging man at 1.7254 level on weekly plotting, ever since then the pair has formed a double top pattern with top 1 at 1.7201 and top 2 at 1.7307 (refer daily chart). On the contrary, the hammer pattern candle has occurred at 1.6582 levels on 22ndJuly.
Can hammer disrupt the double top extension? But the current rallies struggle at 7-DMAs as both the technical indicators are in tandem with the prevailing downtrend.
RSI and stochastic curves have shown downward convergence to the price dips which is an indication of strength and intensified bearish trend. To substantiate this stance, MACD has shown bearish crossover entering the bearish territory that indicates downswings to prolong in near-terms.
Contrary to that, on a broader perspective, the major trend of this pair has developed a rising channel pattern.
The pair has taken support at the midway of 1.6311 levels (refer weekly chart), the current major trend slides below EMAs again with bearish EMA and MACD crossovers, both momentum oscillators have turned extremely bearish bias on this timeframe.
Trade tips: On daily trading grounds, at spot reference: 1.6628 levels, we advocate constructing tunnel spread, using upper strikes at 1.6660 and lower strikes at 1.6525 levels. The strategy is likely to fetch leveraged yields as long as the underlying price keeps dipping but remains above lower strikes on the expiration.
Alternatively, as we could foresee downside risks in the near terms ahead of ECB’s monetary policy, on hedging grounds, we advocate initiating shorts in EURNZD futures contracts of near month expiries and longs in mid-month tenors with a view to arresting further upside risks.


