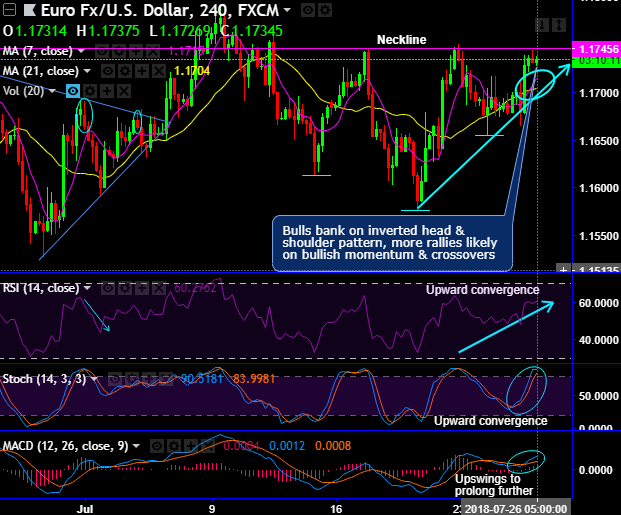
EURUSD bulls bank on the inverted head and shoulder pattern, with shoulder 1 at 1.1613, shoulder 2 at 1.1654, inverted head at 1.1575 and neckline at 1.1745 levels (refer 4H chart).
For now, more rallies seem to be on cards as both leading oscillators (RSI & stochastic curves) indicate intensified bullish momentum and both lagging indicators (bullish SMA and MACD crossovers) signal upswings to prolong further on this timeframe.
The price rallies have halted at neckline and oscillate between the mid-points of the current 1.1510 to 1.1800/1.1850 range.
While the medium-term momentum studies are constructive of further rallies, with our underlying bias for a move back towards 1.20-1.22. However, it would take a break through the range highs to add real conviction to this view. Near-term price action warns that we remain in a range for now if not risk a re-test of the supports.
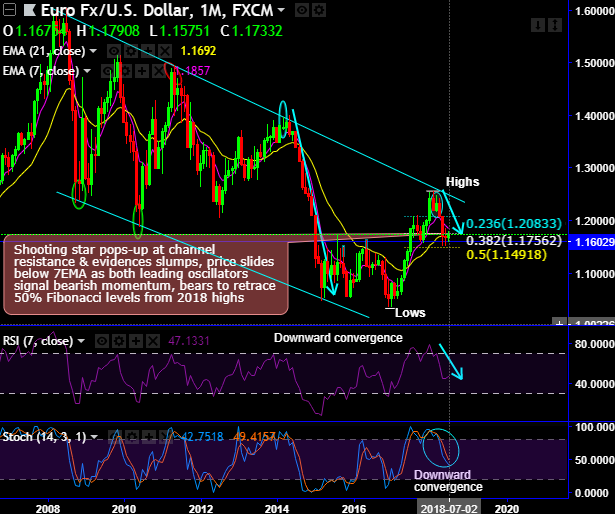
As per our long-term analysis, the major trend has been sliding through the sloping channel (refer monthly chart).
As you could easily observe, the shooting star pattern pops-up at channel resistance, consequently, the bearish pattern candlestick evidences slumps.
The current price slides below 7EMA as both leading oscillators signal bearish momentum, bears to retrace 50% Fibonacci levels from 2018 highs.
We also highlight 1.0340 as a major low, which bottomed-out the cycle from the 1.60 highs in 2008. We foresee the current medium-term pullback as corrective and expect a broader range to develop. Ultimately, the charts signal an eventual move back towards 1.30-1.35 and then 1.45-1.50 levels.
At spot reference: 1.1735 levels, capitalizing on prevailing bullish momentum, one can bid one-touch call options with strikes at 1.1745 levels, the strategy is likely to derive exponential yields as long as the underlying spot keeps spiking on expiration.
On hedging grounds, stay shorts in futures contracts of mid-month tenors with a view to arresting bearish risks.
Currency Strength Index: FxWirePro's hourly EUR spot index is inching towards -16 levels (which is neutral ahead of today’s ECB’s monetary policy), while hourly USD spot index was at -102 (bearish) while articulating (at 06:19 GMT). For more details on the index, please refer below weblink: